Introduction
This chapter is concerned with the hundreds of individuals who created the suburban fabric of Battersea after 1840, the scale of their operations, financing, successes and failures. Before 1840, the sources are insufficient for detailed analysis. The District Surveyors’ Returns, District and Metropolitan Boards of Works’ minutes, rate books, deeds and mortgages have been used to compile a Builder Index 1840-1915 (Appendix 3a).
Three important provisos must be made at the outset. (1) There are gaps in the data, mostly during the 1860s boom, which conceal many short-lived builders and the full duration and extent of others’ activities. (2) Many described as “builders” belonged to other trades or professions, for example surveyors and architects acting for the estate owner or developer. Others were individual building tradesmen, who cooperated together in erecting houses. Yet others, more difficult to detect, were not in the building industry at all, but were investors, tradesmen and others who held the head lease of the property. They often appear in the sources as “builders”, although they sub-contracted the work to third parties, often the sub-lessee of the house. In compiling the Builder Index, the first and third of these categories have been omitted where it has been possible to obtain a definite cross-check on true occupations. Building tradesmen have been left in. (3) Concerns the activities of builders outside Battersea, before, during or after the period when they built locally. A brief examination of DSRs for neighbouring areas (Fulham, Clapham and Lambeth), suggests that a significant proportion were active in more than one area, albeit over a relatively short range. Such building has been ignored here because a comprehensive statement of the output of any builder would require a complete indexing of DSRs for London, and of comparable records for adjacent areas of Surrey, Middlesex, Kent and Essex before one could be certain that all the work of any individual had been traced.
Other sections examine the financing of building operations, the socio-economic profile of builders from the Census and the Board of Trade and Booth surveys of the late-1880s, and the supply of building materials.
Battersea Builders: Duration and Scale of Operations
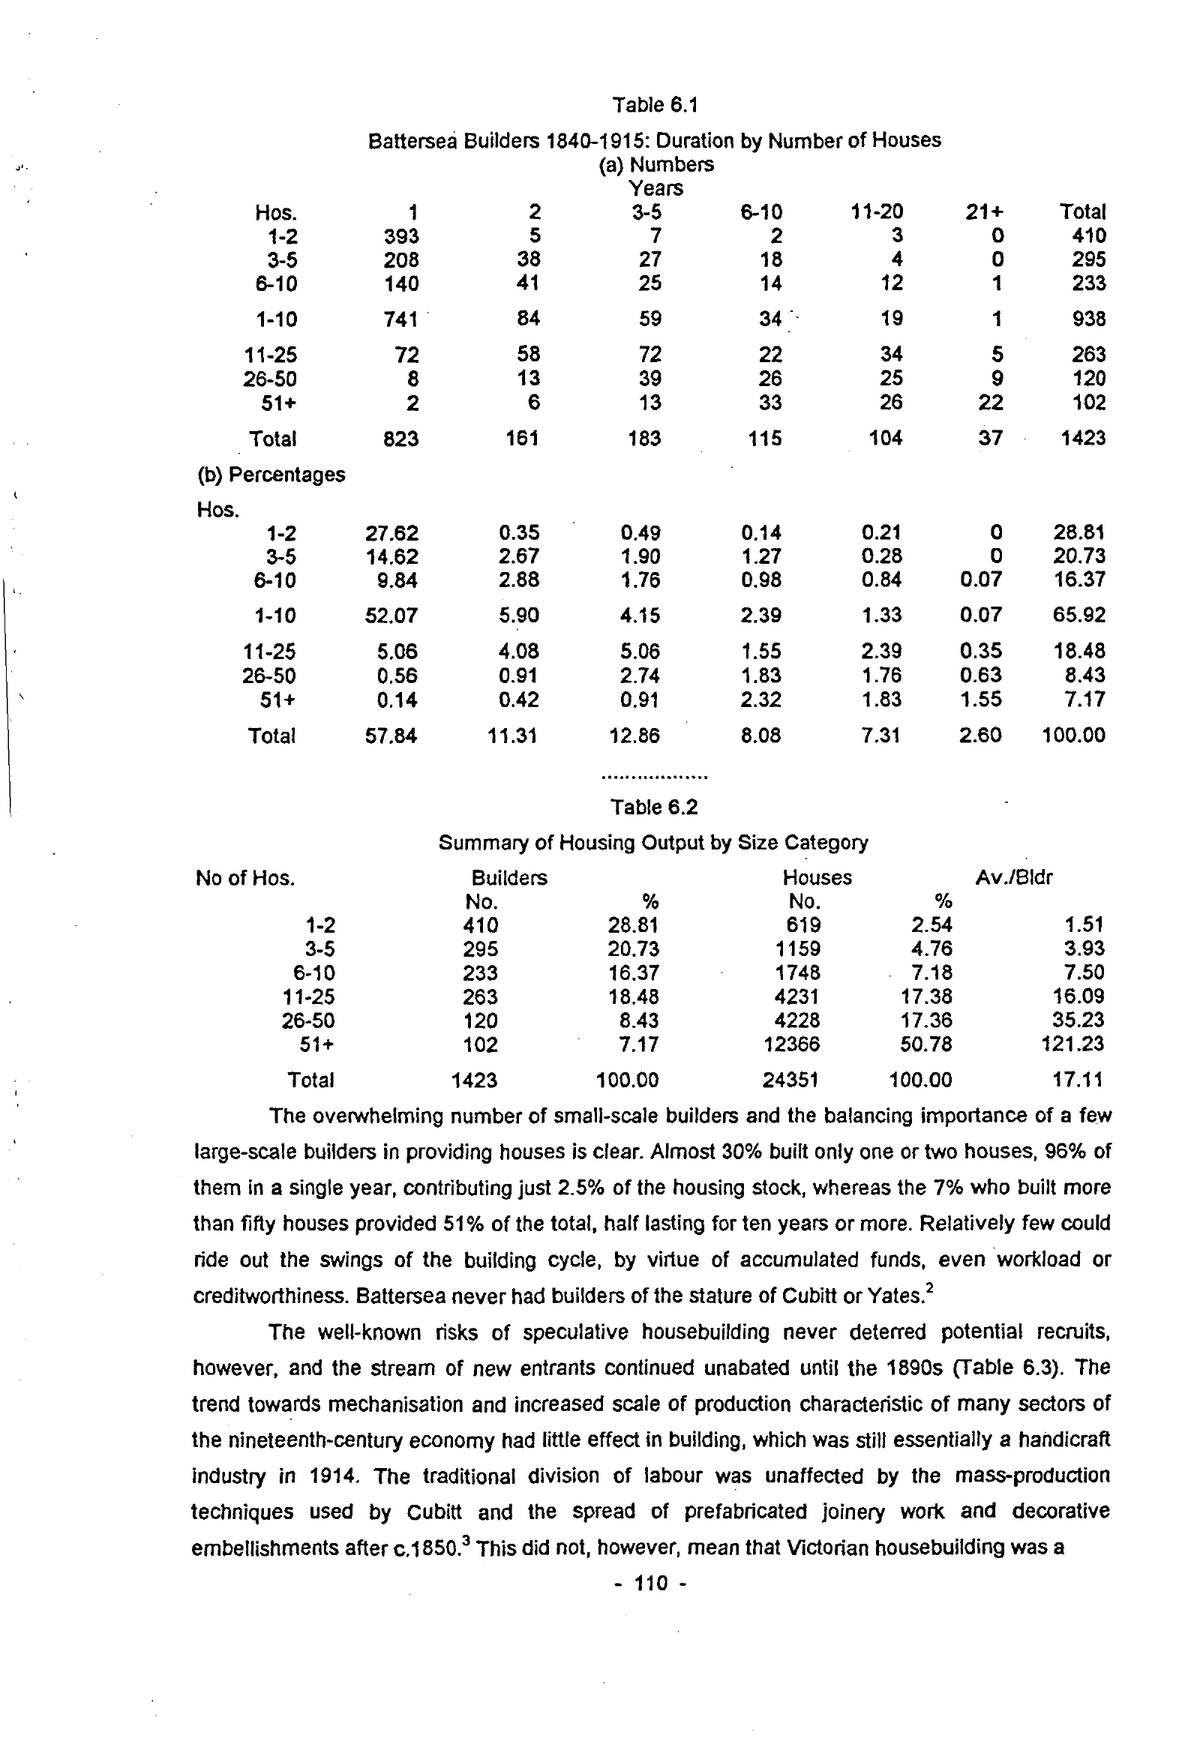
The Builder Index includes 1423 individuals or firms, who built 24,351 houses, flats and maisonettes, an overall average of seventeen each, reinforcing the view that the Victorian building world in London was pre-eminently the preserve of the small operator.1 Table 6.1 is a matrix of the duration of builders by houses built, Table 6.2 summarises the data on the number of builders and houses by size category, and the average output by each builder.
| (a) Numbers | |||||||
|---|---|---|---|---|---|---|---|
| Years | |||||||
| Hos. | 1 | 2 | 3-5 | 6-10 | 11-20 | 21+ | Total |
| 1-2 | 393 | 5 | 7 | 2 | 3 | 0 | 410 |
| 3-5 | 208 | 38 | 27 | 18 | 4 | 0 | 295 |
| 6-10 | 140 | 41 | 25 | 14 | 12 | 1 | 233 |
| 1-10 | 741 | 84 | 59 | 34 | 19 | 1 | 938 |
| 11-25 | 72 | 58 | 72 | 22 | 34 | 5 | 263 |
| 26-50 | 8 | 13 | 39 | 26 | 25 | 9 | 120 |
| 51+ | 2 | 6 | 13 | 33 | 26 | 22 | 102 |
| Total | 823 | 161 | 183 | 115 | 104 | 37 | 1423 |
| (b) Percentages | |||||||
| Hos. | |||||||
| 1-2 | 27.62 | 0.35 | 0.49 | 0.14 | 0.21 | 0 | 28.81 |
| 3-5 | 14.62 | 2.67 | 1.90 | 1.27 | 0.28 | 0 | 20.73 |
| 6-10 | 9.84 | 2.88 | 1.76 | 0.98 | 0.84 | 0.07 | 16.37 |
| 1-10 | 52.07 | 5.90 | 4.15 | 2.39 | 1.33 | 0.07 | 65.92 |
| 11-25 | 5.06 | 4.08 | 5.06 | 1.55 | 2.39 | 0.35 | 18.48 |
| 26-50 | 0.56 | 0.91 | 2.74 | 1.83 | 1.76 | 0.63 | 8.43 |
| 51+ | 0.14 | 0.42 | 0.91 | 2.32 | 1.83 | 1.55 | 7.17 |
| Total | 57.84 | 11.31 | 12.86 | 8.08 | 7.31 | 2.60 | 100.00 |
· · ·
| No of Hos. | Builders | Houses | Av./Bldr | ||
|---|---|---|---|---|---|
| No. | % | No. | % | ||
| 1-2 | 410 | 28.81 | 619 | 2.54 | 1.51 |
| 3-5 | 295 | 20.73 | 1159 | 4.76 | 3.93 |
| 6-10 | 233 | 16.37 | 1748 | 7.18 | 7.50 |
| 11-25 | 263 | 18.48 | 4231 | 17.38 | 16.09 |
| 26-50 | 120 | 8.43 | 4228 | 17.36 | 35.23 |
| 51+ | 102 | 7.17 | 12366 | 50.78 | 121.23 |
| Total | 1423 | 100.00 | 24351 | 100.00 | 17.11 |
The overwhelming number of small-scale builders and the balancing importance of a few large-scale builders in providing houses is clear. Almost 30% built only one or two houses, 96% of them in a single year, contributing just 2.5% of the housing stock, whereas the 7% who built more than fifty houses provided 51% of the total, half lasting for ten years or more. Relatively few could ride out the swings of the building cycle, by virtue of accumulated funds, even workload or creditworthiness. Battersea never had builders of the stature of Cubitt or Yates.2
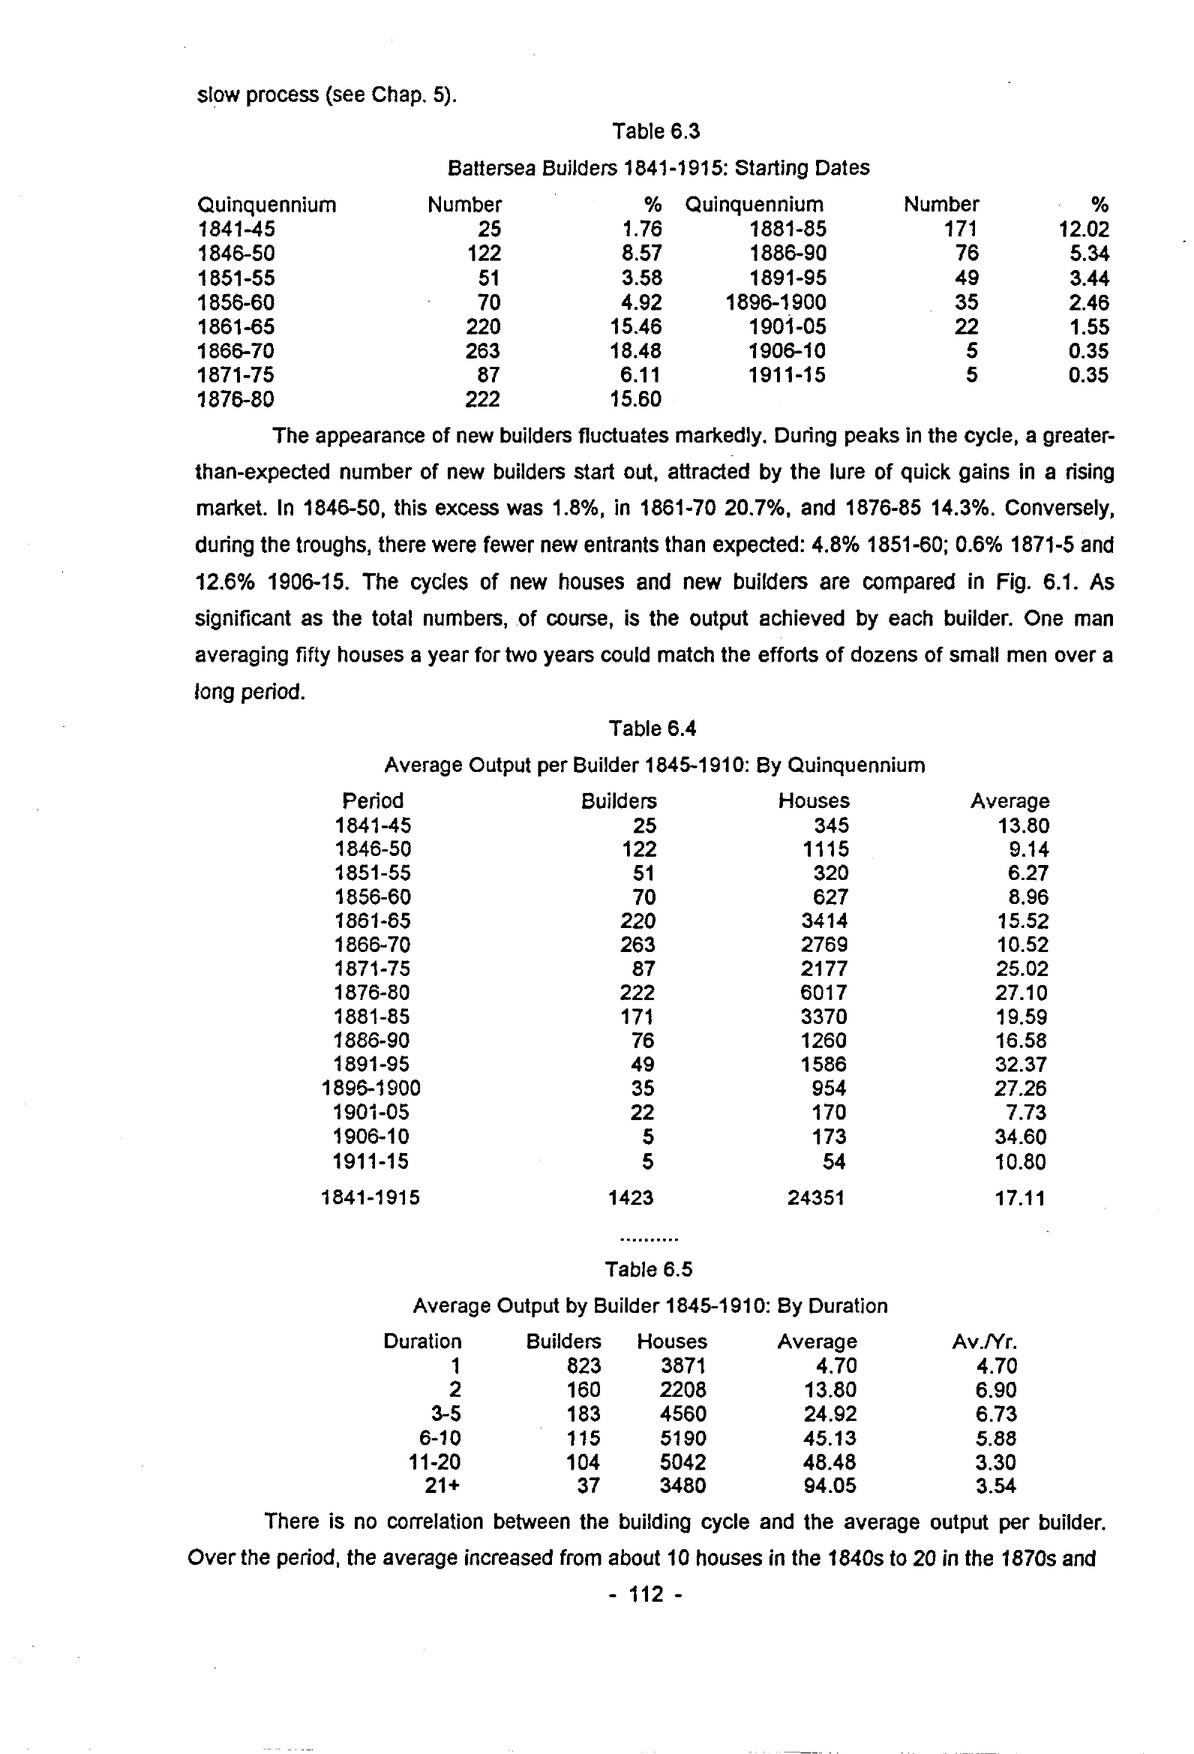
The well-known risks of speculative housebuilding never deterred potential recruits, however, and the stream of new entrants continued unabated until the 1890s (Table 6.3). The trend towards mechanisation and increased scale of production characteristic of many sectors of the nineteenth-century economy had little effect in building, which was still essentially a handicraft industry in 1914. The traditional division of labour was unaffected by the mass-production techniques used by Cubitt and the spread of prefabricated joinery work and decorative embellishments after c.1850.3 This did not, however, mean that Victorian housebuilding was a
Open zoomable view
p. 112slow process (see Chap. 5).
| Quinquennium | Number | % | Quinquennium | Number | % |
|---|---|---|---|---|---|
| 1841-45 | 25 | 1.76 | 1881-85 | 171 | 12.02 |
| 1846-50 | 122 | 8.57 | 1886-90 | 76 | 5.34 |
| 1851-55 | 51 | 3.58 | 1891-95 | 49 | 3.44 |
| 1856-60 | 70 | 4.92 | 1896-1900 | 35 | 2.46 |
| 1861-65 | 220 | 15.46 | 1901-05 | 22 | 1.55 |
| 1866-70 | 263 | 18.48 | 1906-10 | 5 | 0.35 |
| 1871-75 | 87 | 6.11 | 1911-15 | 5 | 0.35 |
| 1876-80 | 222 | 15.60 |
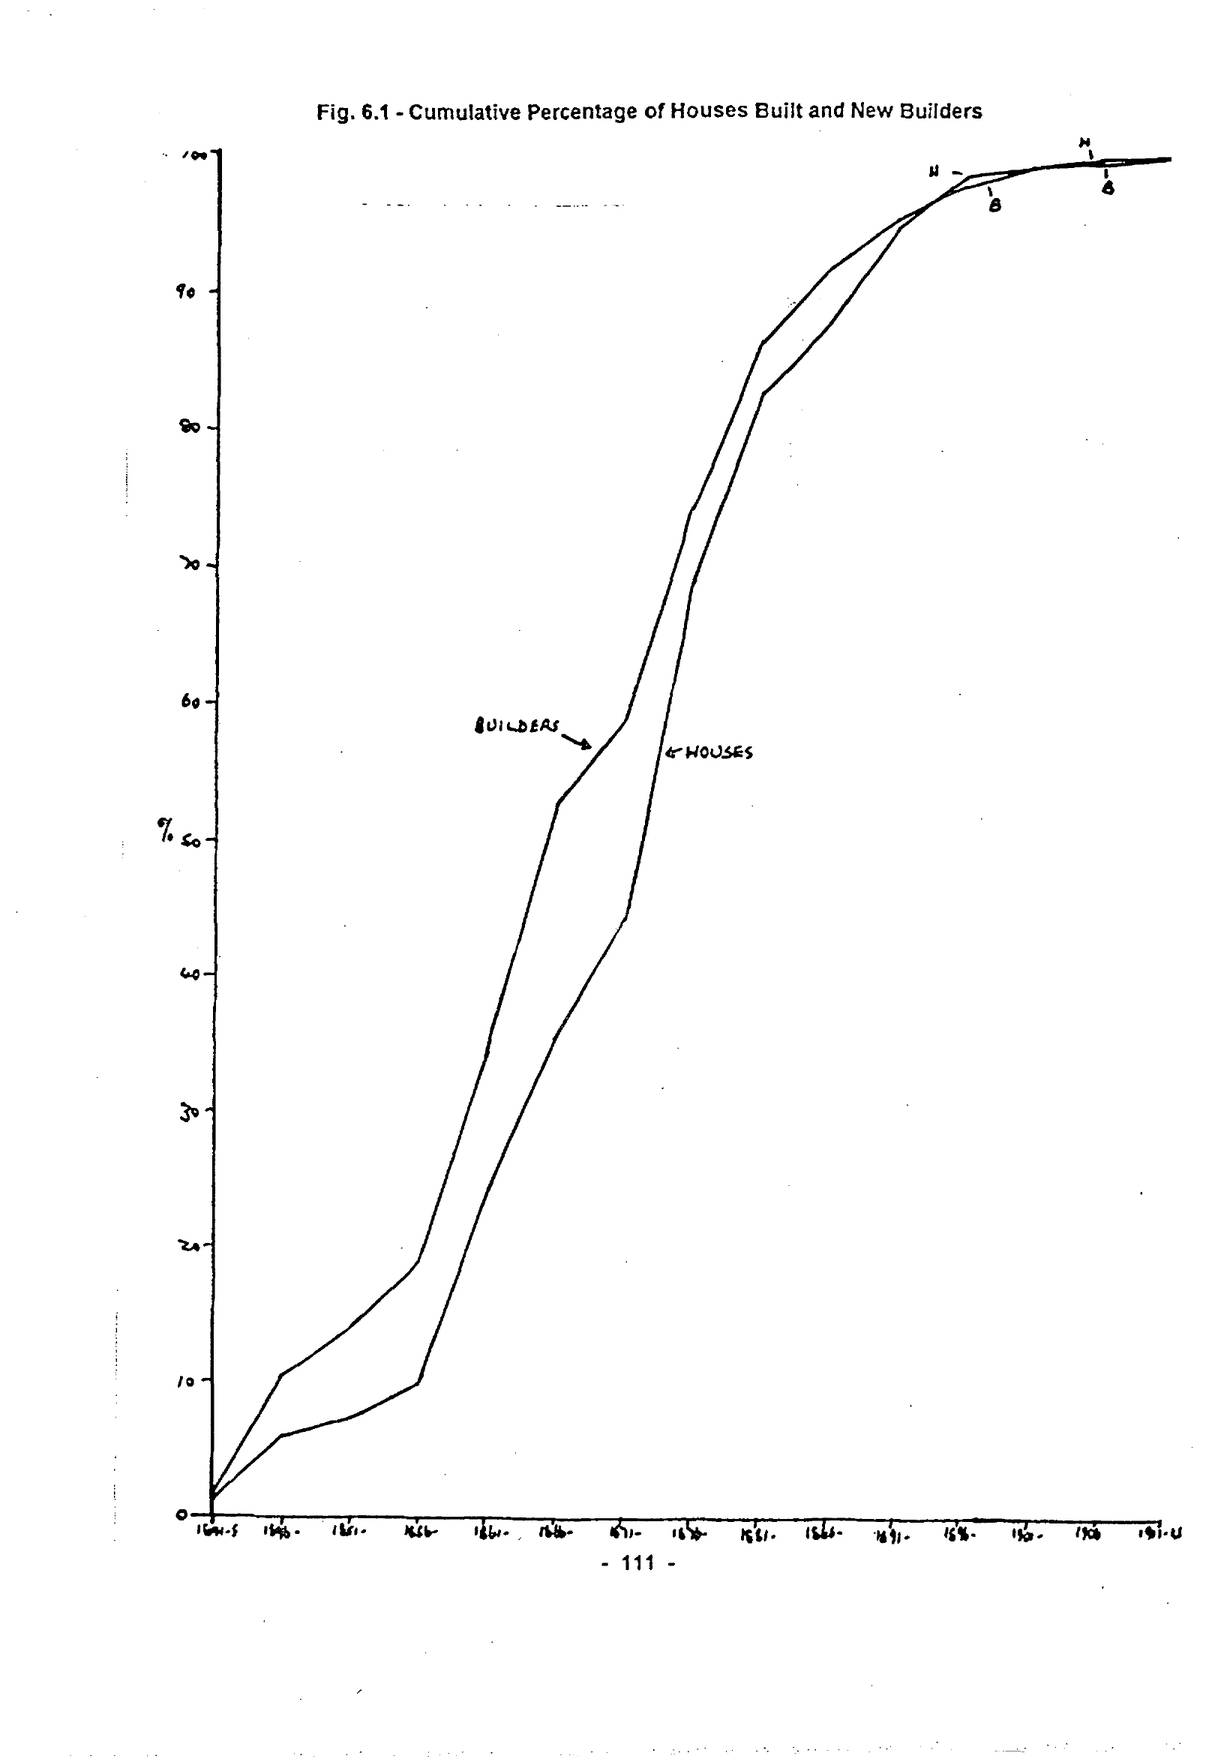
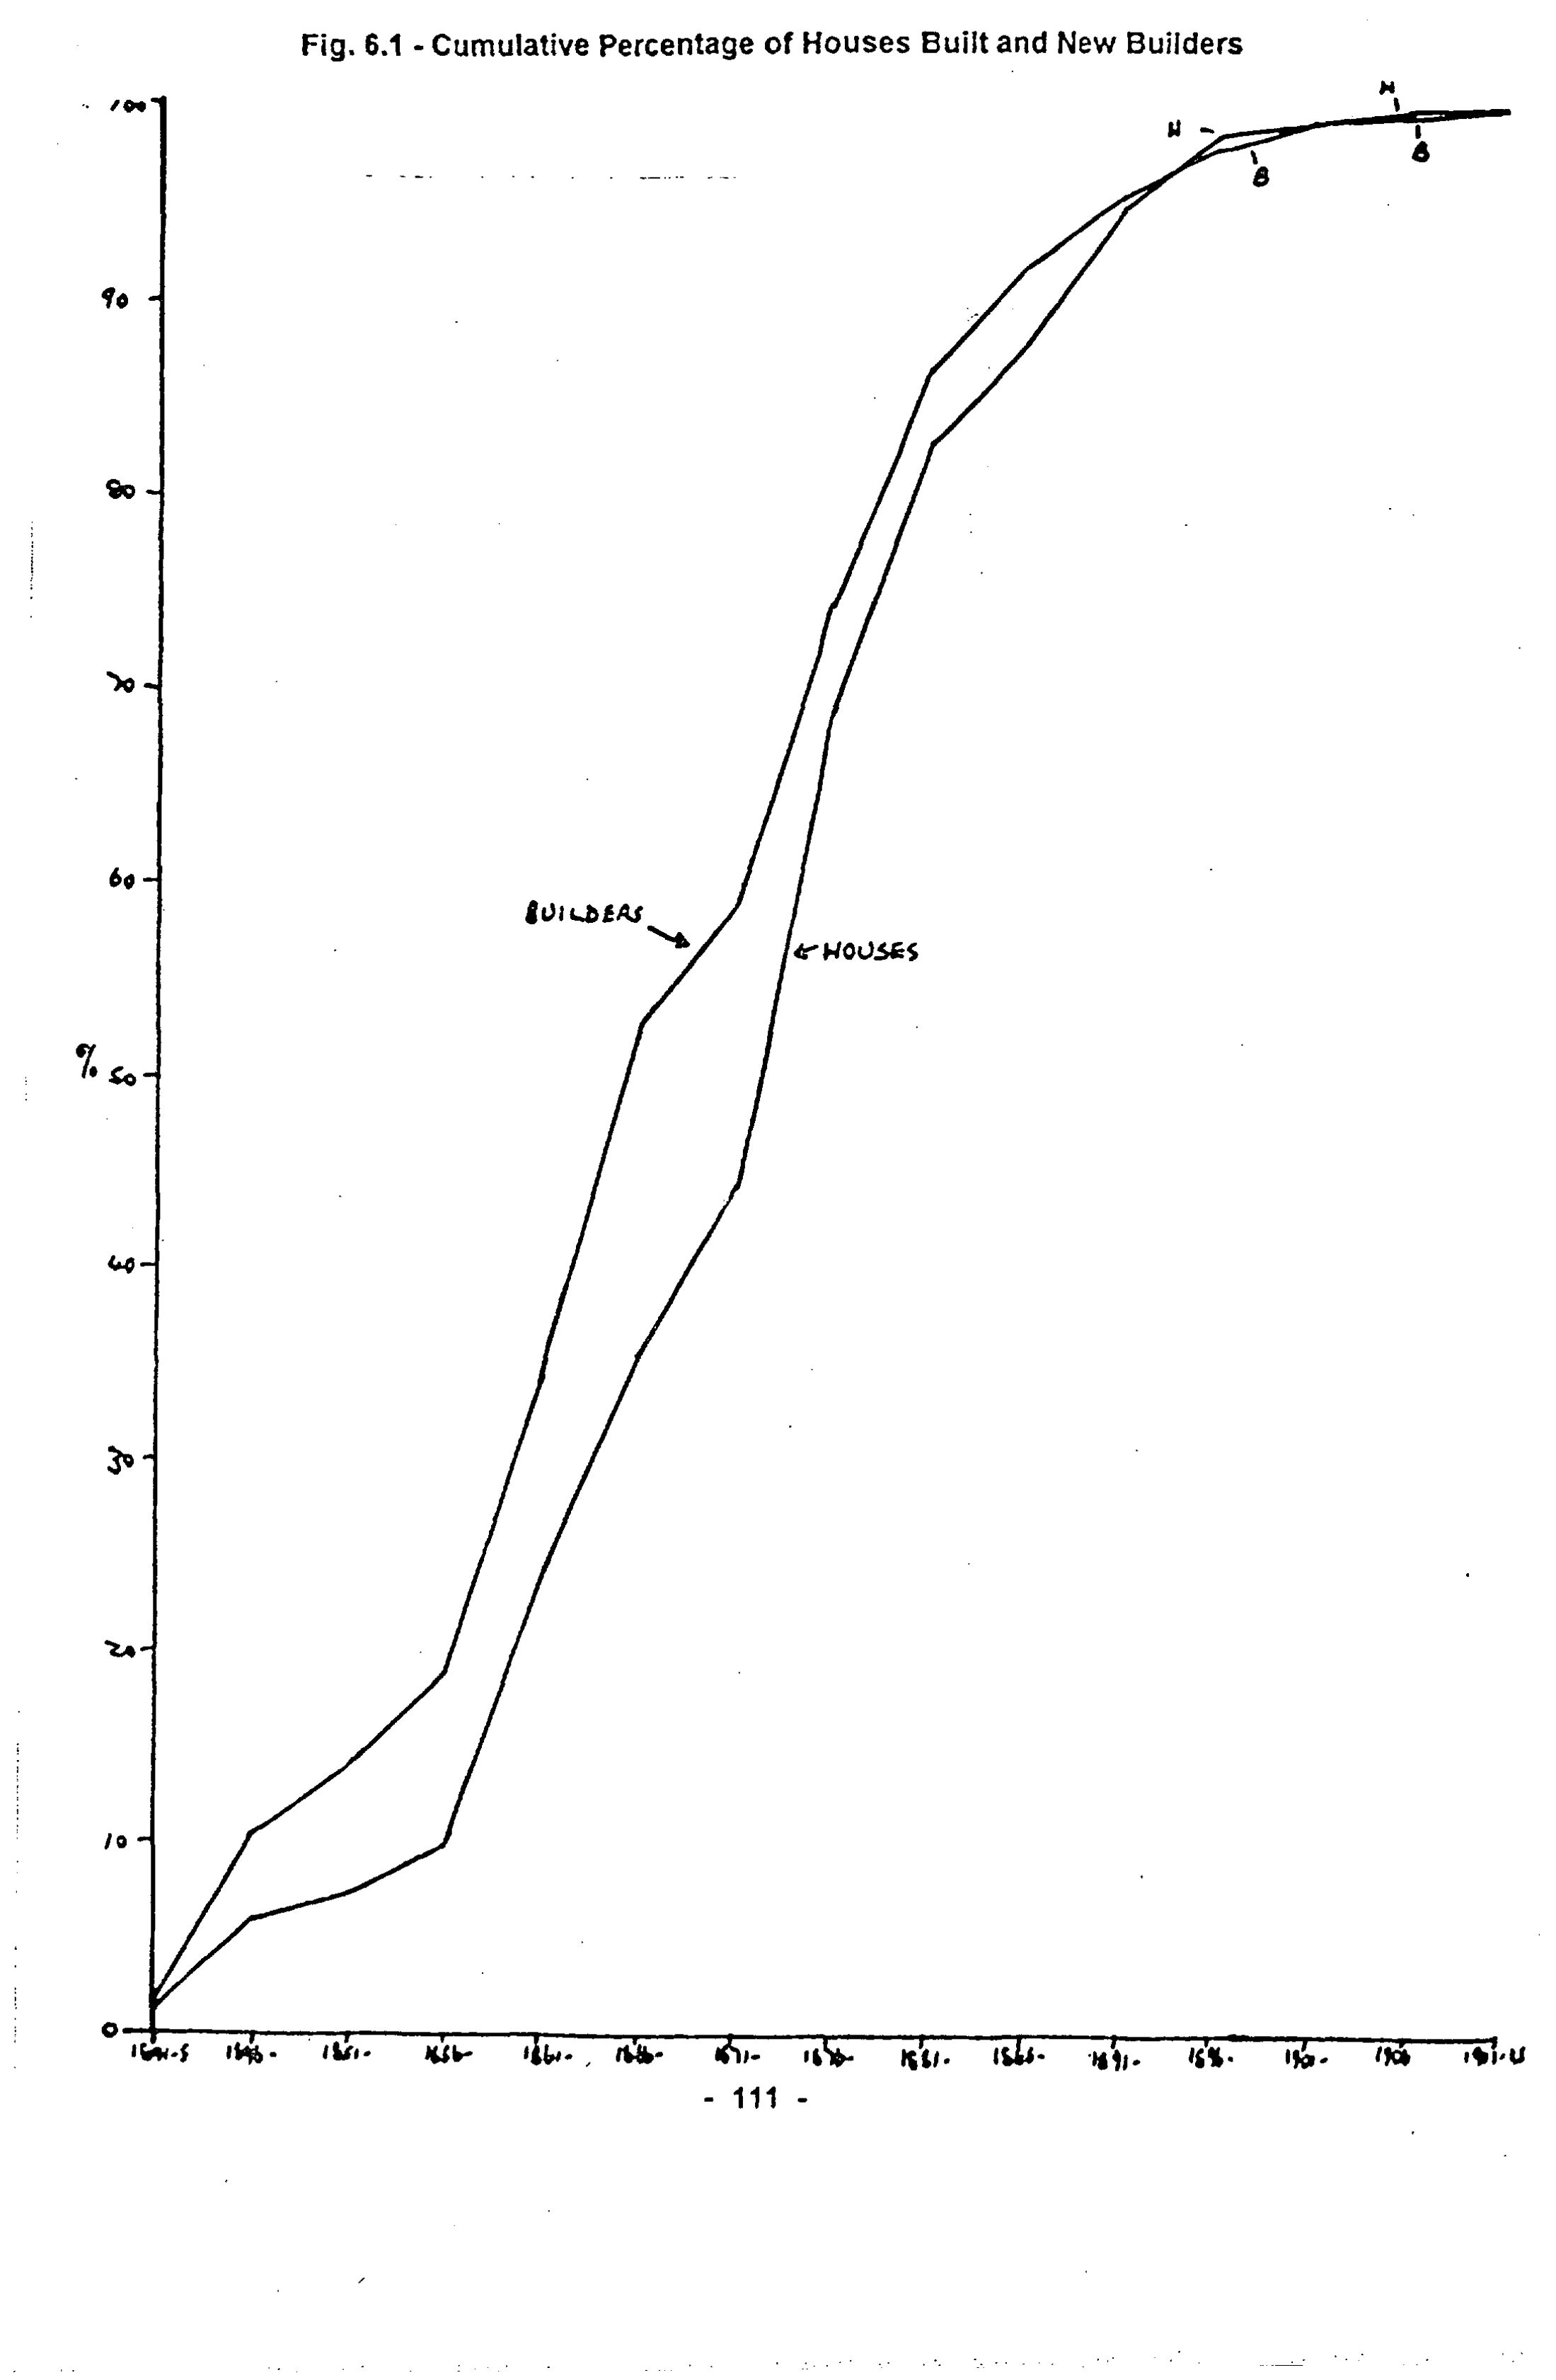
The appearance of new builders fluctuates markedly. During peaks in the cycle, a greater-than-expected number of new builders start out, attracted by the lure of quick gains in a rising market. In 1846-50, this excess was 1.8%, in 1861-70 20.7%, and 1876-85 14.3%. Conversely, during the troughs, there were fewer new entrants than expected: 4.8% 1851-60; 0.6% 1871-5 and 12.6% 1906-15. The cycles of new houses and new builders are compared in Fig. 6.1. As significant as the total numbers, of course, is the output achieved by each builder. One man averaging fifty houses a year for two years could match the efforts of dozens of small men over a long period.
| Period | Builders | Houses | Average |
|---|---|---|---|
| 1841-45 | 25 | 345 | 13.80 |
| 1846-50 | 122 | 1115 | 9.14 |
| 1851-55 | 51 | 320 | 6.27 |
| 1856-60 | 70 | 627 | 8.96 |
| 1861-65 | 220 | 3414 | 15.52 |
| 1866-70 | 263 | 2769 | 10.52 |
| 1871-75 | 87 | 2177 | 25.02 |
| 1876-80 | 222 | 6017 | 27.10 |
| 1881-85 | 171 | 3370 | 19.59 |
| 1886-90 | 76 | 1260 | 16.58 |
| 1891-95 | 49 | 1586 | 32.37 |
| 1896-1900 | 35 | 954 | 27.26 |
| 1901-05 | 22 | 170 | 7.73 |
| 1906-10 | 5 | 173 | 34.60 |
| 1911-15 | 5 | 54 | 10.80 |
| 1841-1915 | 1423 | 24351 | 17.11 |
· · ·
| Duration | Builders | Houses | Average | Av./Yr. |
|---|---|---|---|---|
| 1 | 823 | 3871 | 4.70 | 4.70 |
| 2 | 160 | 2208 | 13.80 | 6.90 |
| 3-5 | 183 | 4560 | 24.92 | 6.73 |
| 6-10 | 115 | 5190 | 45.13 | 5.88 |
| 11-20 | 104 | 5042 | 48.48 | 3.30 |
| 21+ | 37 | 3480 | 94.05 | 3.54 |
There is no correlation between the building cycle and the average output per builder. Over the period, the average increased from about 10 houses in the 1840s to 20 in the 1870s and
p. 11330 in the 1890s. The annual average of houses per builder never exceeded seven, and the majority only achieved four or six houses each year, equivalent to two or three pairs of typical tunnel-back houses.
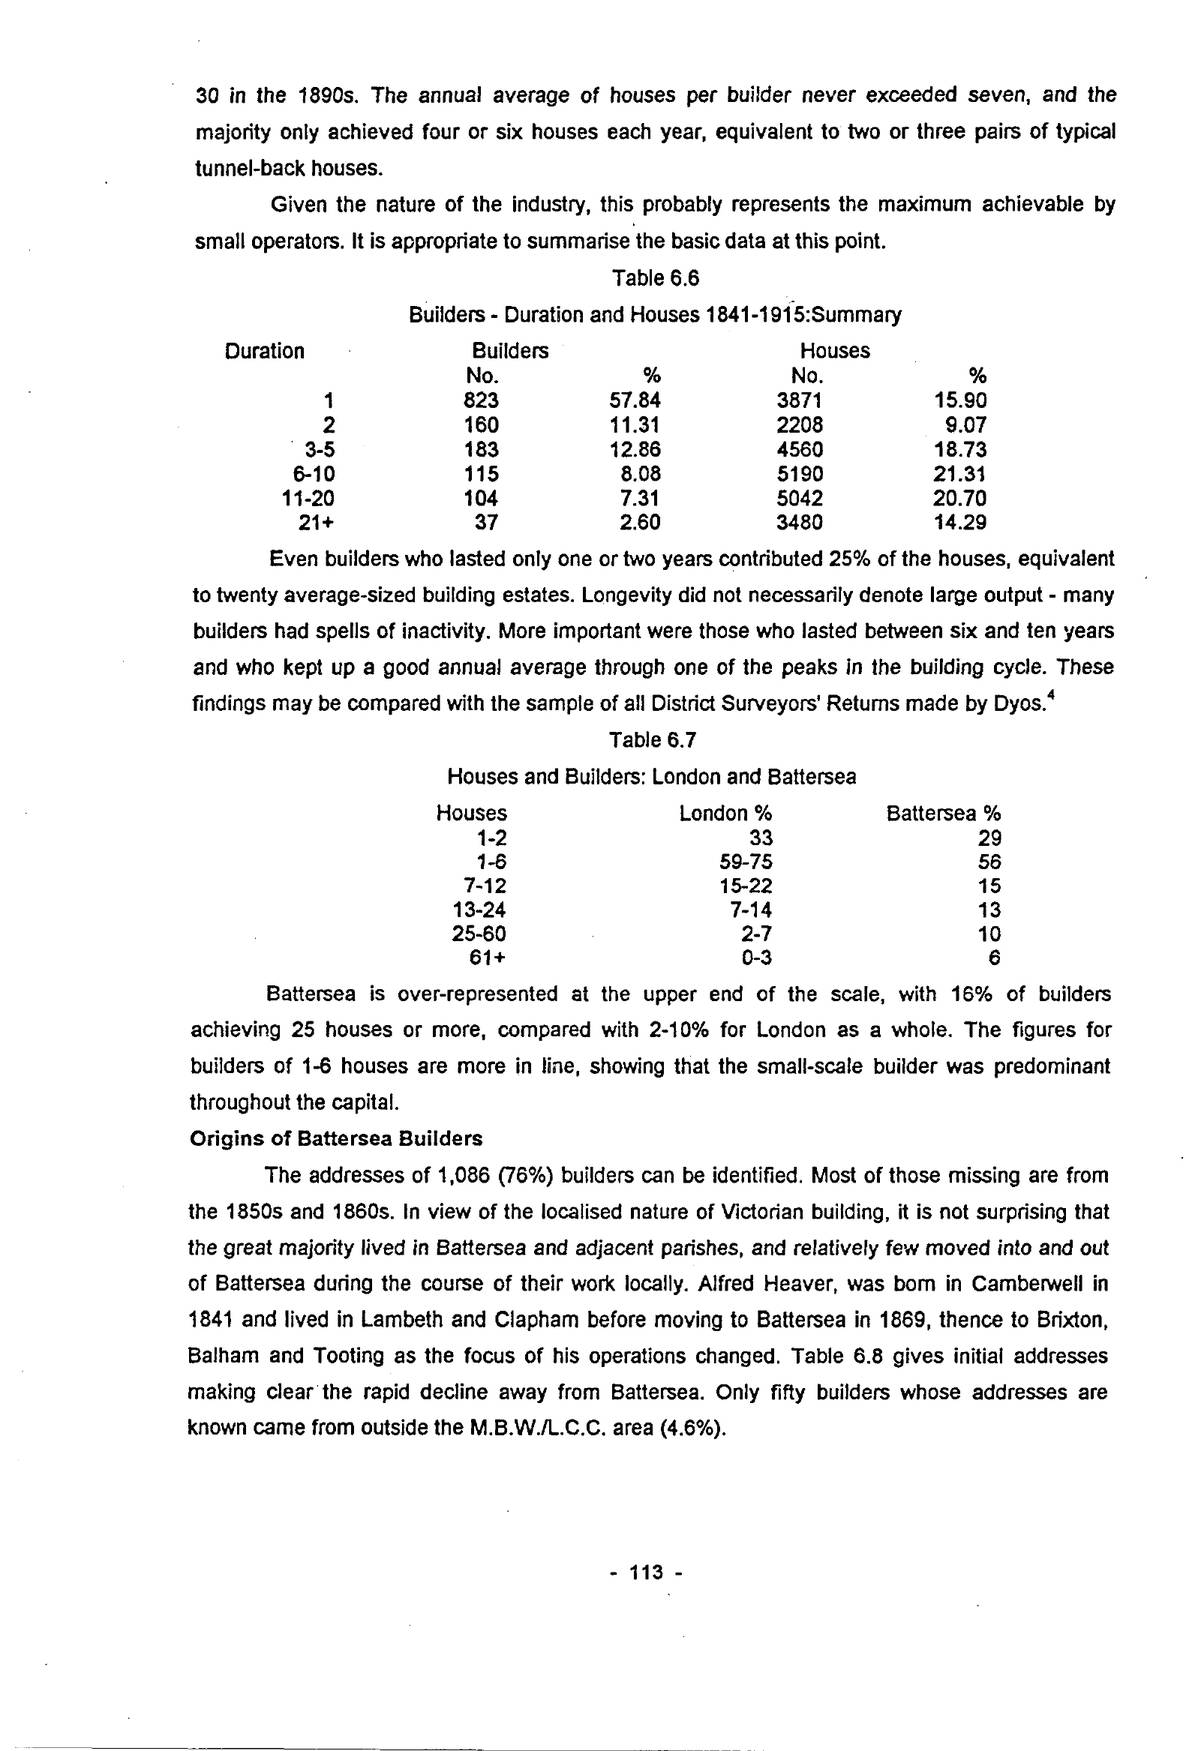
Given the nature of the industry, this probably represents the maximum achievable by small operators. It is appropriate to summarise the basic data at this point.
| Duration | Builders | Houses | ||
|---|---|---|---|---|
| No. | % | No. | % | |
| 1 | 823 | 57.84 | 3871 | 15.90 |
| 2 | 160 | 11.31 | 2208 | 9.07 |
| 3-5 | 183 | 12.86 | 4560 | 18.73 |
| 6-10 | 115 | 8.08 | 5190 | 21.31 |
| 11-20 | 104 | 7.31 | 5042 | 20.70 |
| 21+ | 37 | 2.60 | 3480 | 14.29 |
Even builders who lasted only one or two years contributed 25% of the houses, equivalent to twenty average-sized building estates. Longevity did not necessarily denote large output – many builders had spells of inactivity. More important were those who lasted between six and ten years and who kept up a good annual average through one of the peaks in the building cycle. These findings may be compared with the sample of all District Surveyors’ Returns made by Dyos.4
| Houses | London % | Battersea % |
|---|---|---|
| 1-2 | 33 | 29 |
| 1-6 | 59-75 | 56 |
| 7-12 | 15-22 | 15 |
| 13-24 | 7-14 | 13 |
| 25-60 | 2-7 | 10 |
| 61+ | 0-3 | 6 |
Battersea is over-represented at the upper end of the scale, with 16% of builders achieving 25 houses or more, compared with 2-10% for London as a whole. The figures for builders of 1-6 houses are more in line, showing that the small-scale builder was predominant throughout the capital.
Origins of Battersea Builders
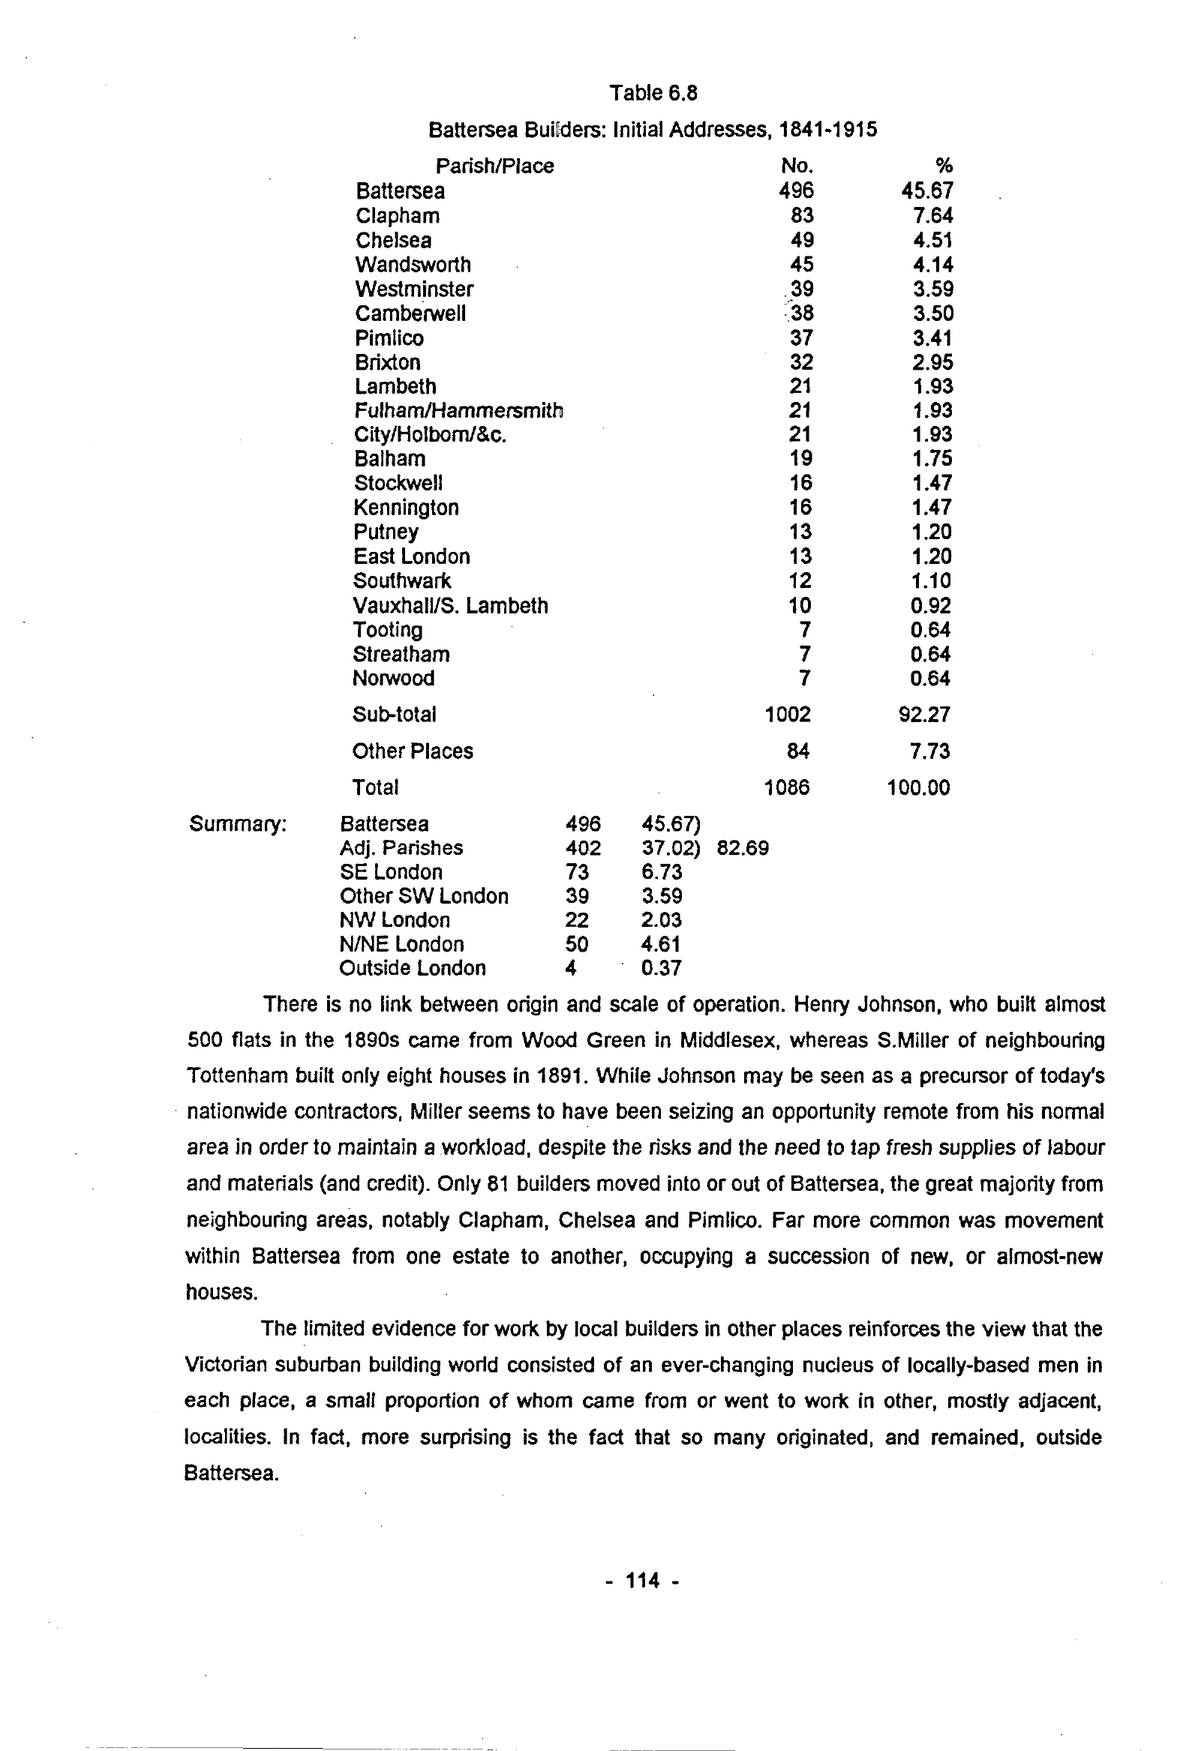
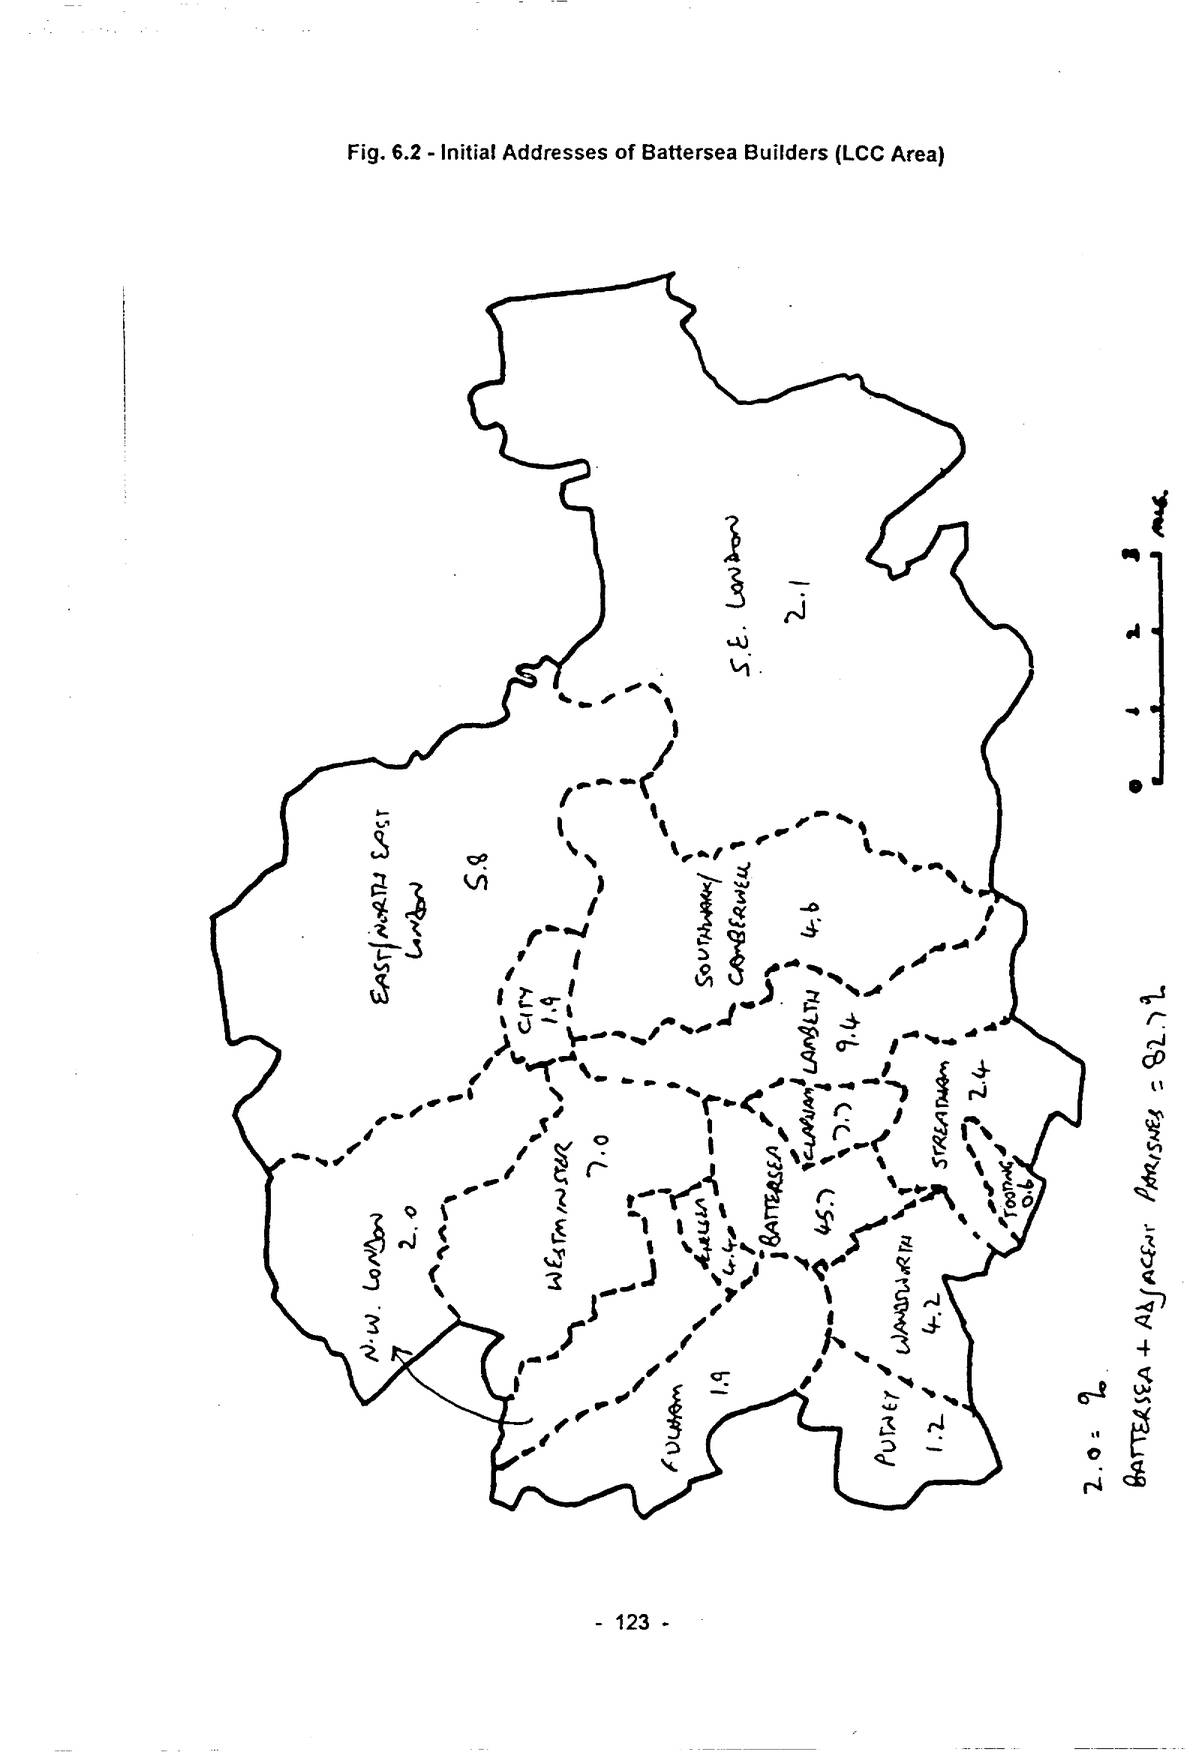
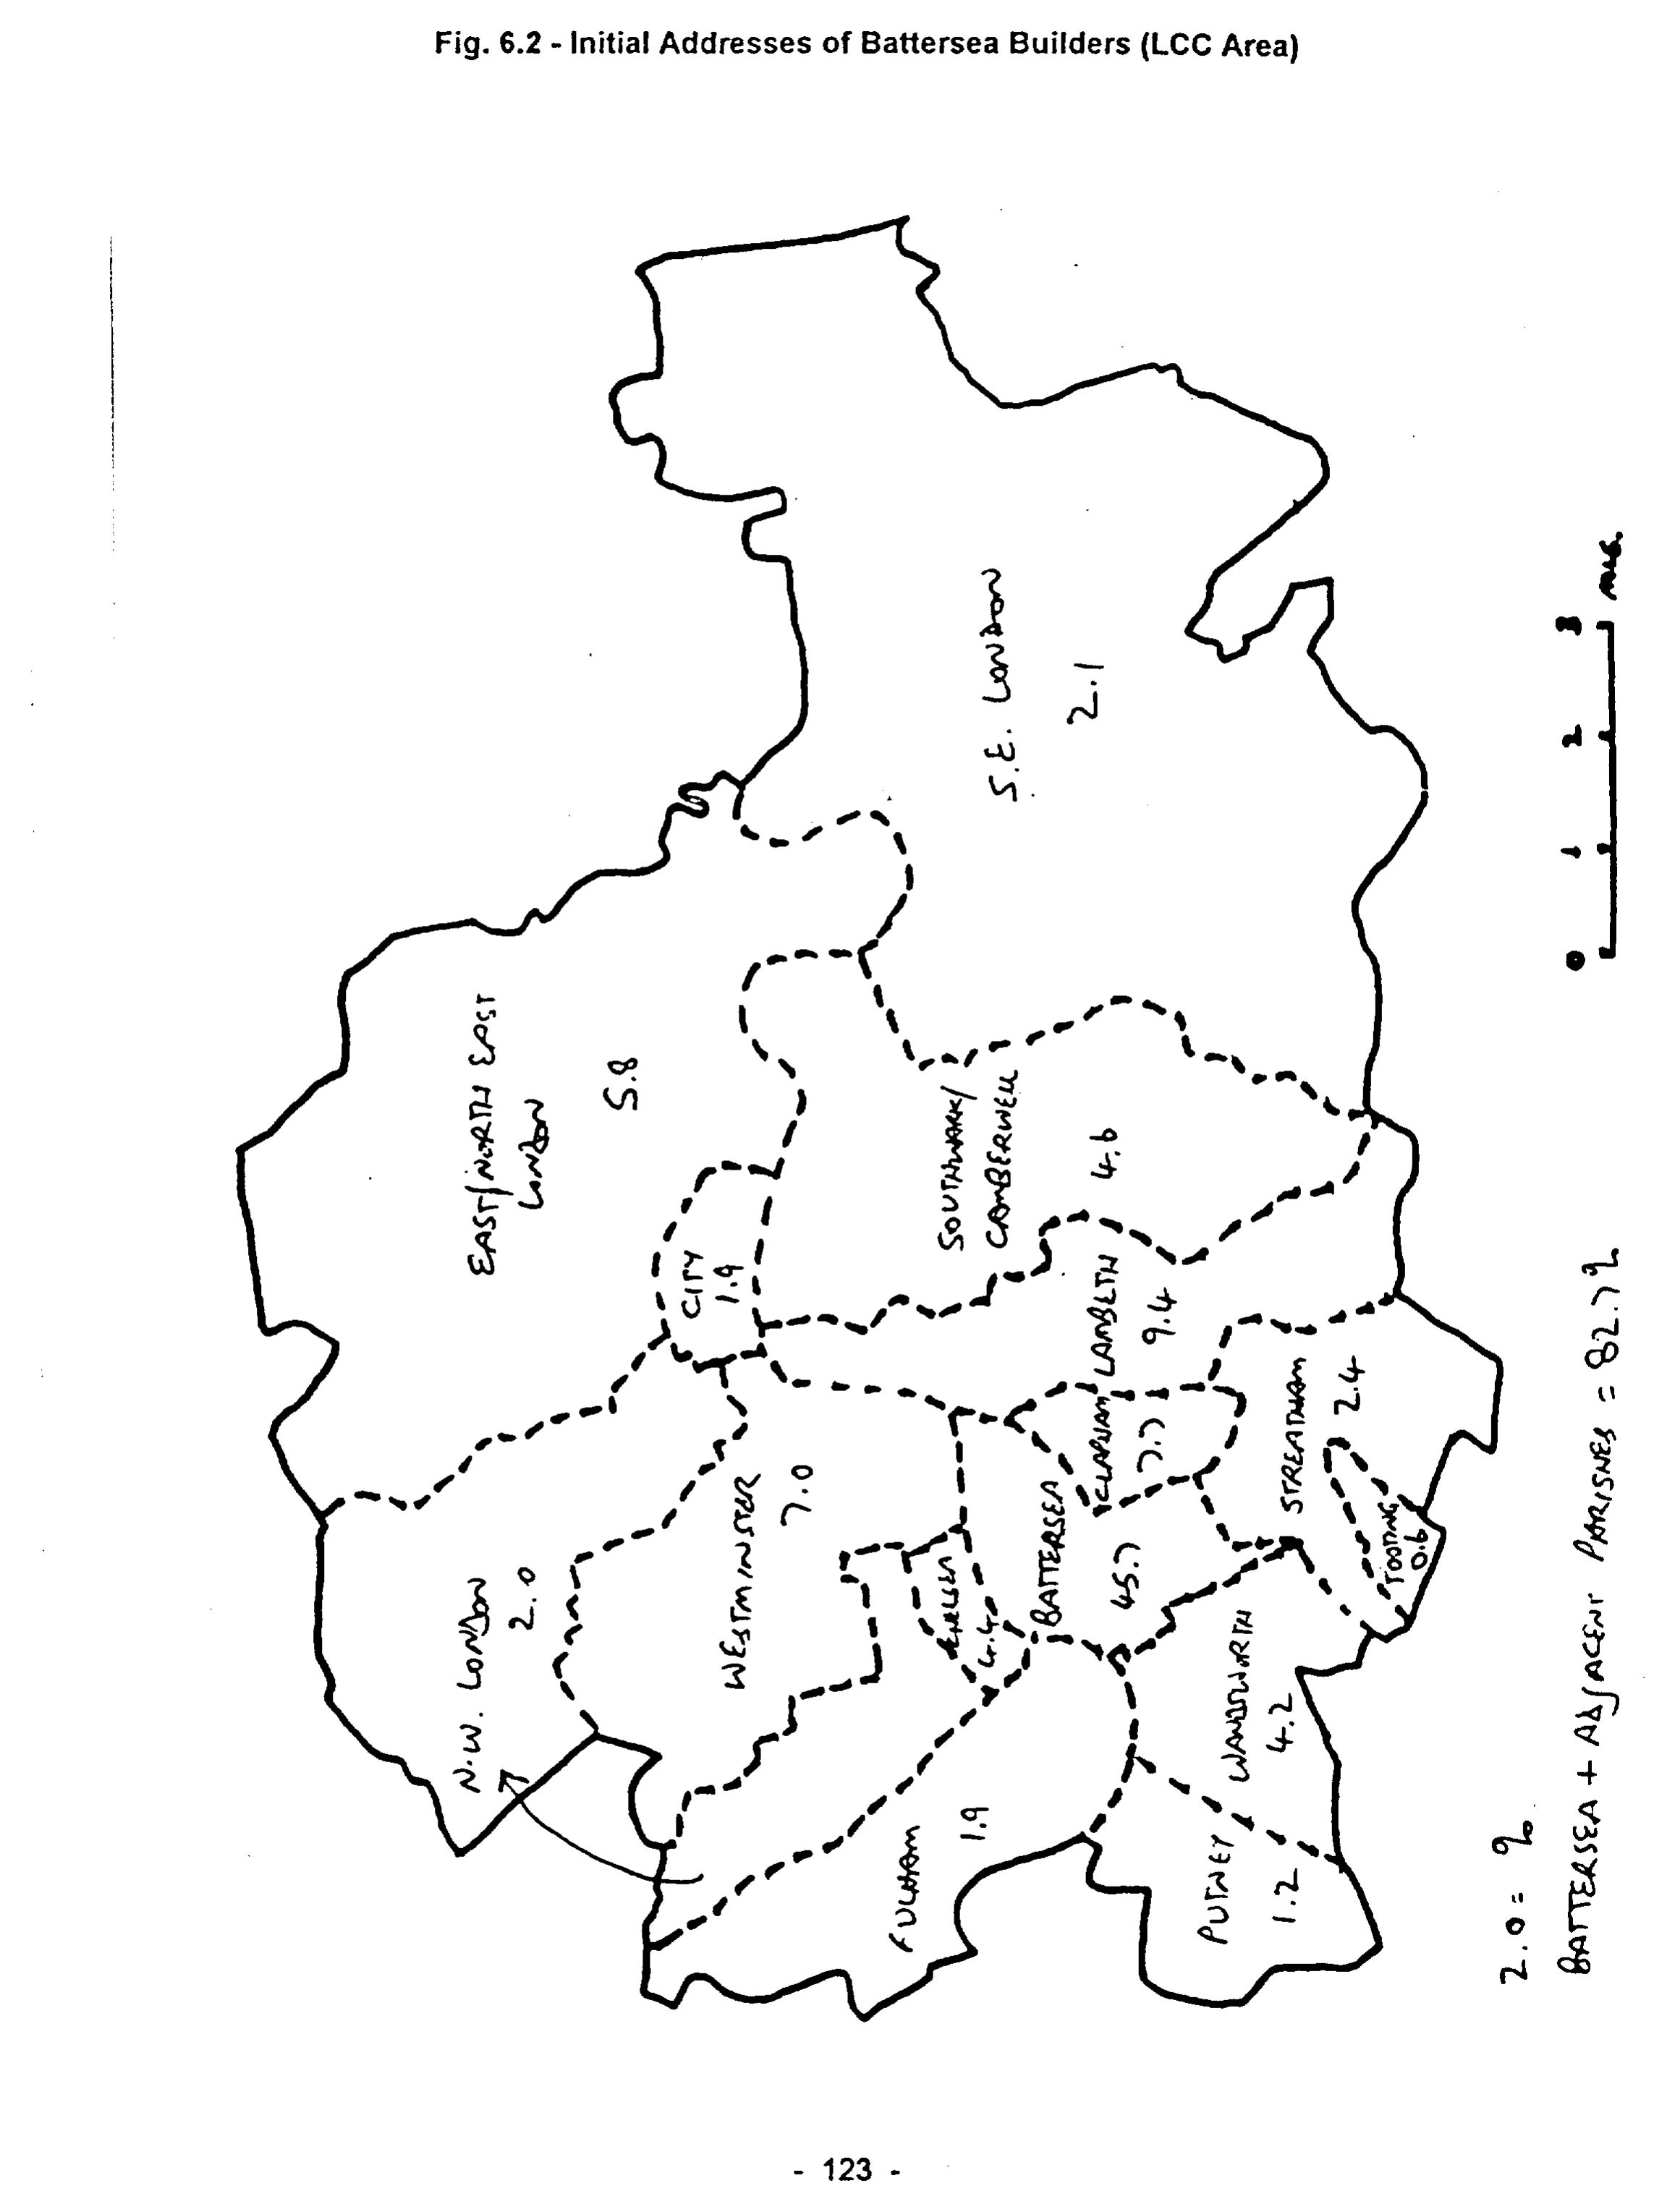
The addresses of 1,086 (76%) builders can be identified. Most of those missing are from the 1850s and 1860s. In view of the localised nature of Victorian building, it is not surprising that the great majority lived in Battersea and adjacent parishes, and relatively few moved into and out of Battersea during the course of their work locally. Alfred Heaver, was born in Camberwell in 1841 and lived in Lambeth and Clapham before moving to Battersea in 1869, thence to Brixton, Balham and Tooting as the focus of his operations changed. Table 6.8 gives initial addresses making clear the rapid decline away from Battersea. Only fifty builders whose addresses are known came from outside the M.B.W./L.C.C. area (4.6%).
| Parish/Place | No. | % |
|---|---|---|
| Battersea | 496 | 45.67 |
| Clapham | 83 | 7.64 |
| Chelsea | 49 | 4.51 |
| Wandsworth | 45 | 4.14 |
| Westminster | 39 | 3.59 |
| Camberwell | 38 | 3.50 |
| Pimlico | 37 | 3.41 |
| Brixton | 32 | 2.95 |
| Lambeth | 21 | 1.93 |
| Fulham/Hammersmith | 21 | 1.93 |
| City/Holborn/&c. | 21 | 1.93 |
| Balham | 19 | 1.75 |
| Stockwell | 16 | 1.47 |
| Kennington | 16 | 1.47 |
| Putney | 13 | 1.20 |
| East London | 13 | 1.20 |
| Southwark | 12 | 1.10 |
| Vauxhall/S. Lambeth | 10 | 0.92 |
| Tooting | 7 | 0.64 |
| Streatham | 7 | 0.64 |
| Norwood | 7 | 0.64 |
| Sub-total | 1002 | 92.27 |
| Other Places | 84 | 7.73 |
| Total | 1086 | 100.00 |
| Summary: | ||
| Battersea | 496 | 45.67) |
| Adj. Parishes | 402 | 37.02) 82.69 |
| SE London | 73 | 6.73 |
| Other SW London | 39 | 3.59 |
| NW London | 22 | 2.03 |
| N/NE London | 50 | 4.61 |
| Outside London | 4 | 0.37 |
There is no link between origin and scale of operation. Henry Johnson, who built almost 500 flats in the 1890s came from Wood Green in Middlesex, whereas S.Miller of neighbouring Tottenham built only eight houses in 1891. While Johnson may be seen as a precursor of today’s nationwide contractors, Miller seems to have been seizing an opportunity remote from his normal area in order to maintain a workload, despite the risks and the need to tap fresh supplies of labour and materials (and credit). Only 81 builders moved into or out of Battersea, the great majority from neighbouring areas, notably Clapham, Chelsea and Pimlico. Far more common was movement within Battersea from one estate to another, occupying a succession of new, or almost-new houses.
The limited evidence for work by local builders in other places reinforces the view that the Victorian suburban building world consisted of an ever-changing nucleus of locally-based men in each place, a small proportion of whom came from or went to work in other, mostly adjacent, localities. In fact, more surprising is the fact that so many originated, and remained, outside Battersea.
p. 115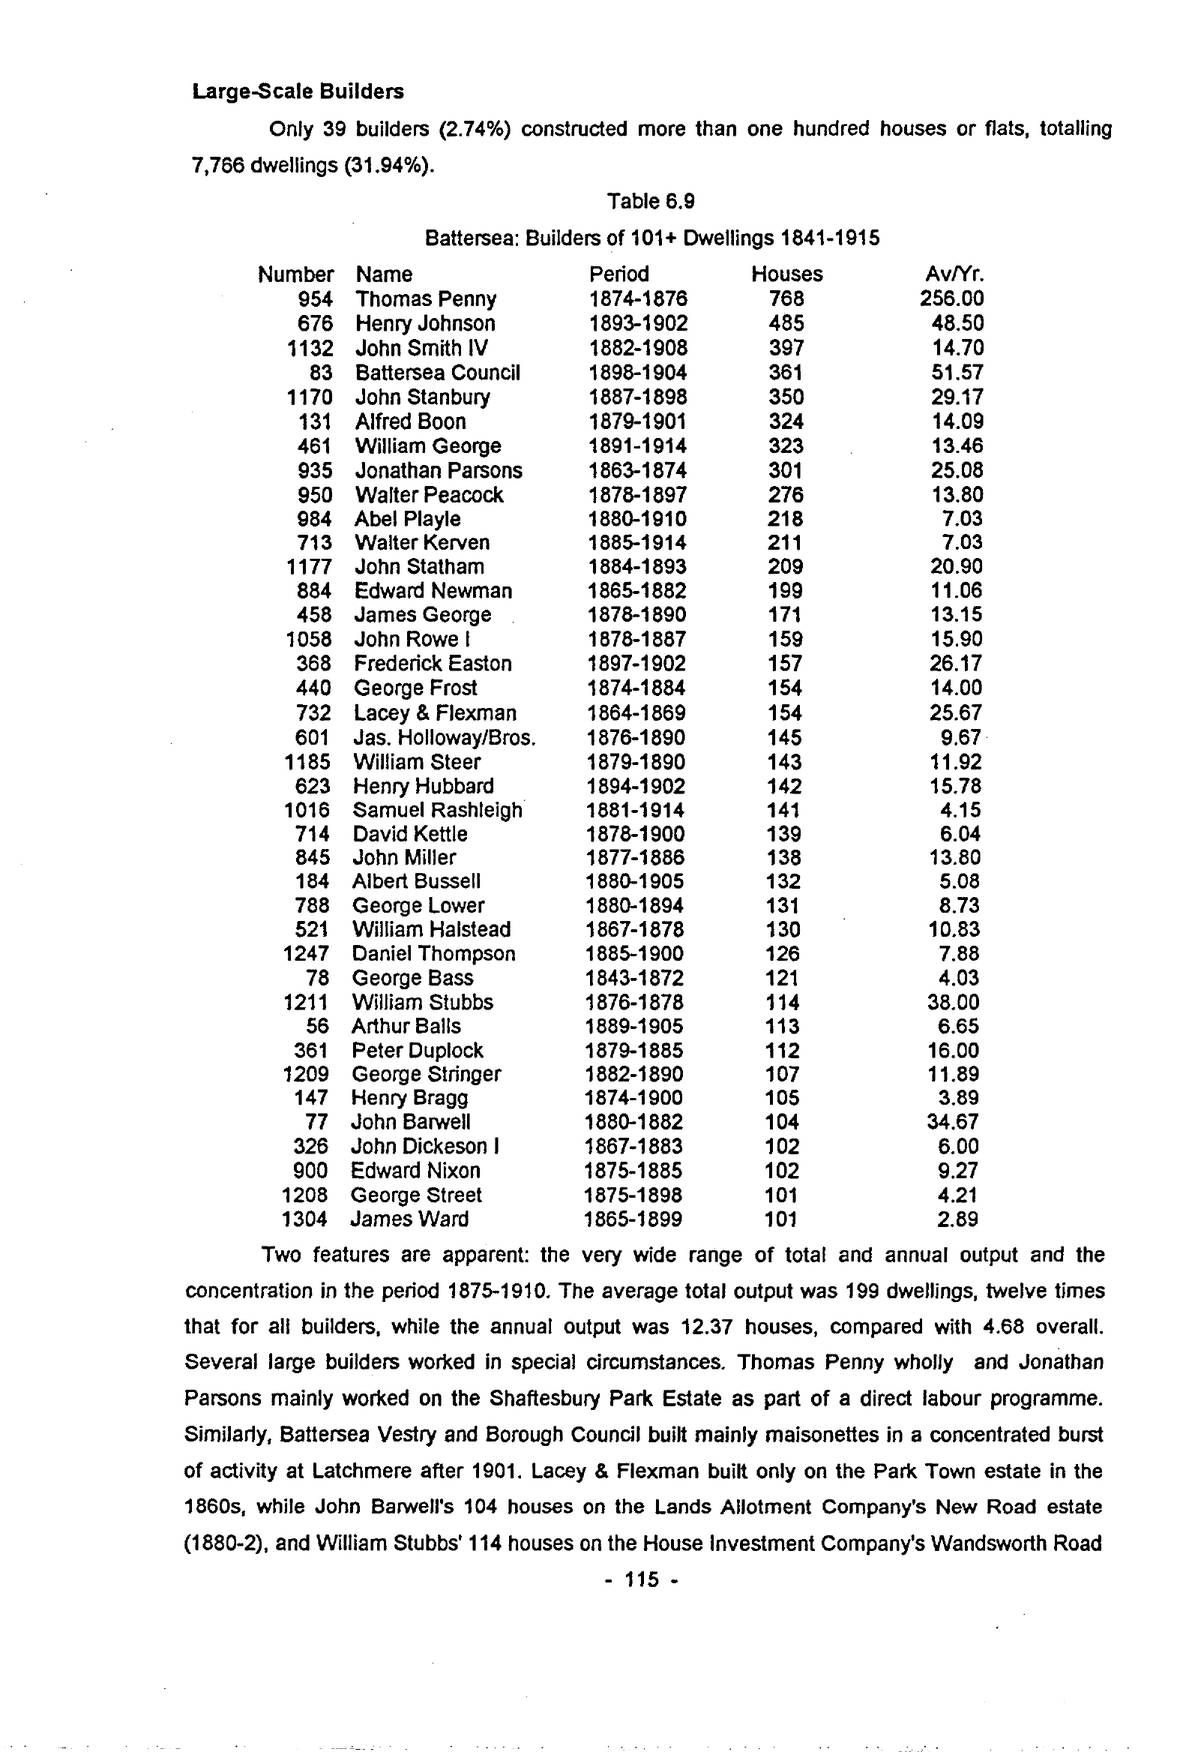
Large-Scale Builders
Only 39 builders (2.74%) constructed more than one hundred houses or flats, totalling 7,766 dwellings (31.94%).
| Number | Name | Period | Houses | Av/Yr. |
|---|---|---|---|---|
| 954 | Thomas Penny | 1874-1876 | 768 | 256.00 |
| 676 | Henry Johnson | 1893-1902 | 485 | 48.50 |
| 1132 | John Smith IV | 1882-1908 | 397 | 14.70 |
| 83 | Battersea Council | 1898-1904 | 361 | 51.57 |
| 1170 | John Stanbury | 1887-1898 | 350 | 29.17 |
| 131 | Alfred Boon | 1879-1901 | 324 | 14.09 |
| 461 | William George | 1891-1914 | 323 | 13.46 |
| 935 | Jonathan Parsons | 1863-1874 | 301 | 25.08 |
| 950 | Walter Peacock | 1878-1897 | 276 | 13.80 |
| 984 | Abel Playle | 1880-1910 | 218 | 7.03 |
| 713 | Walter Kerven | 1885-1914 | 211 | 7.03 |
| 1177 | John Statham | 1884-1893 | 209 | 20.90 |
| 884 | Edward Newman | 1865-1882 | 199 | 11.06 |
| 458 | James George | 1878-1890 | 171 | 13.15 |
| 1058 | John Rowe I | 1878-1887 | 159 | 15.90 |
| 368 | Frederick Easton | 1897-1902 | 157 | 26.17 |
| 440 | George Frost | 1874-1884 | 154 | 14.00 |
| 732 | Lacey & Flexman | 1864-1869 | 154 | 25.67 |
| 601 | Jas. Holloway/Bros. | 1876-1890 | 145 | 9.67 |
| 1185 | William Steer | 1879-1890 | 143 | 11.92 |
| 623 | Henry Hubbard | 1894-1902 | 142 | 15.78 |
| 1016 | Samuel Rashleigh | 1881-1914 | 141 | 4.15 |
| 714 | David Kettle | 1878-1900 | 139 | 6.04 |
| 845 | John Miller | 1877-1886 | 138 | 13.80 |
| 184 | Albert Bussell | 1880-1905 | 132 | 5.08 |
| 788 | George Lower | 1880-1894 | 131 | 8.73 |
| 521 | William Halstead | 1867-1878 | 130 | 10.83 |
| 1247 | Daniel Thompson | 1885-1900 | 126 | 7.88 |
| 78 | George Bass | 1843-1872 | 121 | 4.03 |
| 1211 | William Stubbs | 1876-1878 | 114 | 38.00 |
| 56 | Arthur Balls | 1889-1905 | 113 | 6.65 |
| 361 | Peter Duplock | 1879-1885 | 112 | 16.00 |
| 1209 | George Stringer | 1882-1890 | 107 | 11.89 |
| 147 | Henry Bragg | 1874-1900 | 105 | 3.89 |
| 77 | John Barwell | 1880-1882 | 104 | 34.67 |
| 326 | John Dickeson I | 1867-1883 | 102 | 6.00 |
| 900 | Edward Nixon | 1875-1885 | 102 | 9.27 |
| 1208 | George Street | 1875-1898 | 101 | 4.21 |
| 1304 | James Ward | 1865-1899 | 101 | 2.89 |
Two features are apparent: the very wide range of total and annual output and the concentration in the period 1875-1910. The average total output was 199 dwellings, twelve times that for all builders, while the annual output was 12.37 houses, compared with 4.68 overall. Several large builders worked in special circumstances. Thomas Penny wholly and Jonathan Parsons mainly worked on the Shaftesbury Park Estate as part of a direct labour programme. Similarly, Battersea Vestry and Borough Council built mainly maisonettes in a concentrated burst of activity at Latchmere after 1901. Lacey & Flexman built only on the Park Town estate in the 1860s, while John Barwell’s 104 houses on the Lands Allotment Company’s New Road estate (1880-2), and William Stubbs’ 114 houses on the House Investment Company’s Wandsworth Road
p. 116Estate (1876-8) were probably financed direct by the two companies. Henry Johnson built only mansion flats overlooking of Battersea Park, 500 dwellings 1893-1903. Twenty-one (54%) built less than 150 houses, only eight achieved more than 300. Fourteen builders averaged 10-16 houses/year (i.e. 5-8 “pairs” of houses), which may represent the limit for traditional techniques, requiring an outlay of £1-2,000 for labour and materials. Five builders averaged 20-40 houses/year (£2-5,000 outlay). John Stanbury’s 29 houses/year over twelve years represents a significant proportion of those on estates which he and his family developed jointly with the Corsellises in central and south Battersea. The outlay of £3-4,000 per annum would have been out of the question for the average builder. F. Easton of Wandsworth built almost exclusively on the Northfields and Springwell Estates off Clapham Common, including 135 houses (52%) on the latter in 1897/98 and 1900, when his output reached 51 houses/year, more typical of post-1945 than late-Victorian building. More representative was John Smith, who took 27 years to build 397 houses. From a small beginning on Gillott’s Estate in 1882, he moved to a sequence of developments between the commons, from Dent’s estate in 1883 to Heathfield after 1903. His average of 14.7 houses/year conceals a range from one house in 1888 to 30 in 1904. Smith moved between Stockwell and Battersea until 1890. His output was not very closely related to the building cycle. When a builder crossed a certain financial threshold he seems to have been able to some extent to ignore such fluctuations, especially if building in an area where demand was strong, as it was in south Battersea in the decade after 1895. Alfred Boon, born in Brompton in 1857, began building in 1879 in a small way, but as early as 1882 undertook to develop part of the Crown Estate. He also built several blocks of flats here after 1895. Walter Peacock never moved to Battersea. Starting in Brixton, he was based mainly at 30 Orlando Road, Clapham. Most of his activity was on the Beaufoy and Park Town estates, next to the Clapham boundary.
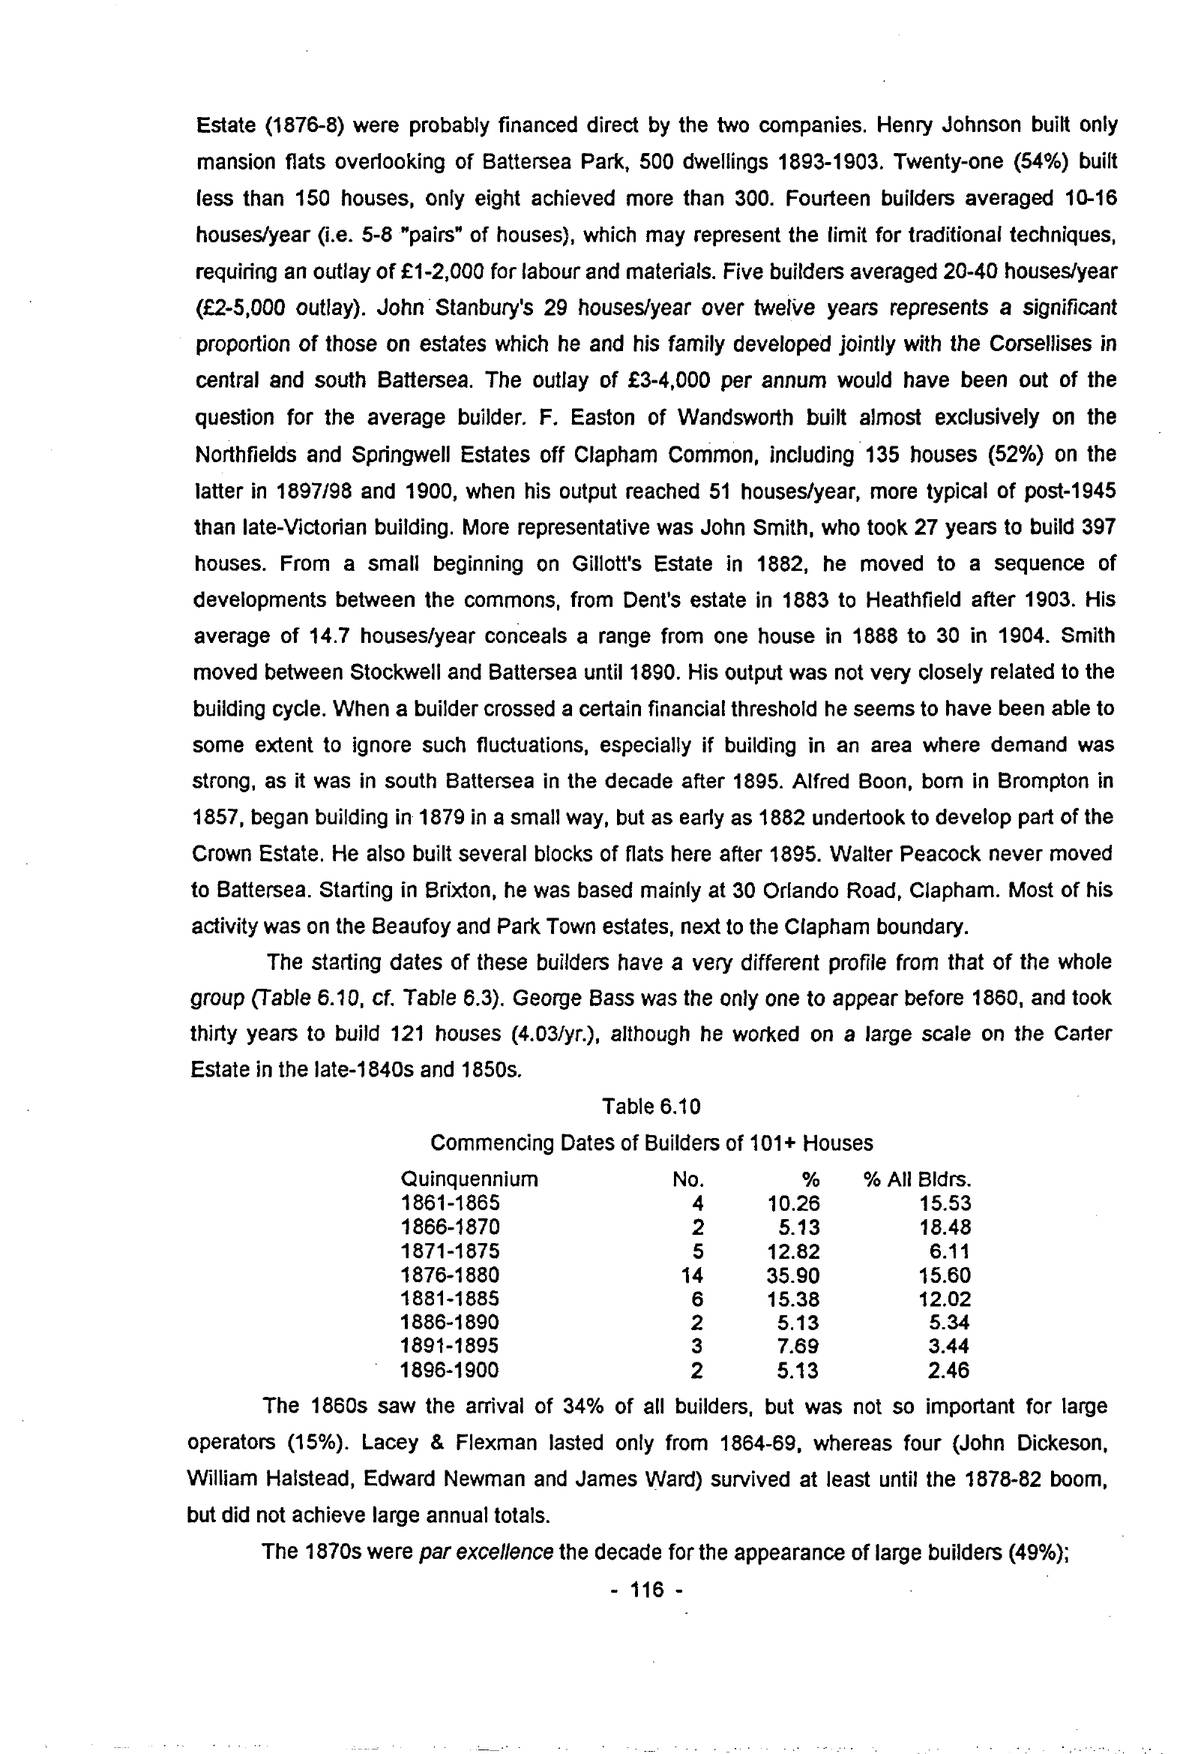
The starting dates of these builders have a very different profile from that of the whole group (Table 6.10, cf. Table 6.3). George Bass was the only one to appear before 1860, and took thirty years to build 121 houses (4.03/yr.), although he worked on a large scale on the Carter Estate in the late-1840s and 1850s.
| Quinquennium | No. | % | % All Bldrs. |
|---|---|---|---|
| 1861-1865 | 4 | 10.26 | 15.53 |
| 1866-1870 | 2 | 5.13 | 18.48 |
| 1871-1875 | 5 | 12.82 | 6.11 |
| 1876-1880 | 14 | 35.90 | 15.60 |
| 1881-1885 | 6 | 15.38 | 12.02 |
| 1886-1890 | 2 | 5.13 | 5.34 |
| 1891-1895 | 3 | 7.69 | 3.44 |
| 1896-1900 | 2 | 5.13 | 2.46 |
The 1860s saw the arrival of 34% of all builders, but was not so important for large operators (15%). Lacey & Flexman lasted only from 1864-69, whereas four (John Dickeson, William Halstead, Edward Newman and James Ward) survived at least until the 1878-82 boom, but did not achieve large annual totals.
The 1870s were par excellence the decade for the appearance of large builders (49%);
p. 117more than twice the expected number in each half of the decade. Many remained active into the Edwardian period. The 1880s saw a secondary peak (20.5%). Given that the flood of small-scale, shortlived builders continued unabated in both decades, these individuals can only be seen as exceptional. Unfortunately, there is insufficient information to define the characteristics which made them so. Prima facie, a “critical mass” of finance is likely to have been the most important reason. Many of these builders either had a special relationship with one organisation (for example, the Artisans’ & General Labourers’ Dwellings Co.), or were restricted to a certain area, or to a special type of building, such as flats. The Census provides few clues about the size of their concerns. In 1881, James Holloway employed 29 men, William Steer 24 men and a boy, James Ward twelve men but David Kettle only five.
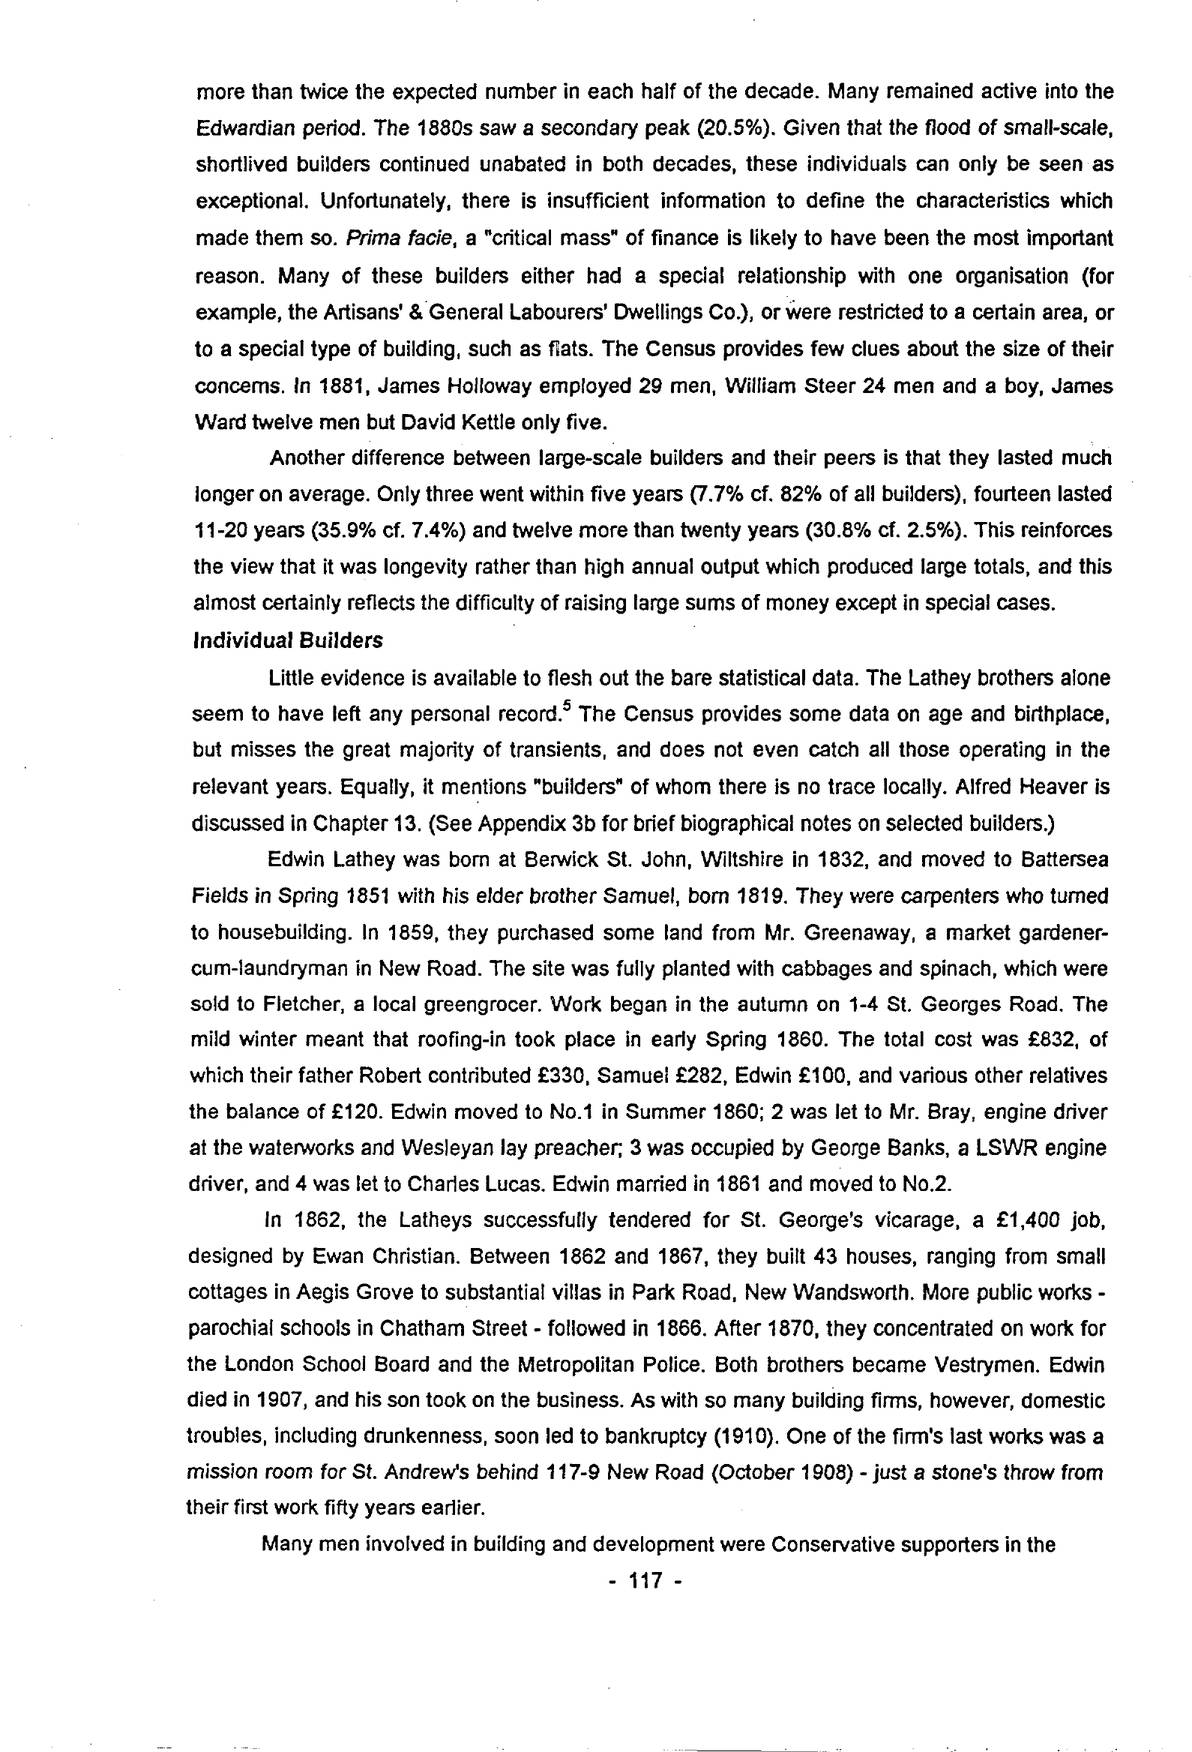
Another difference between large-scale builders and their peers is that they lasted much longer on average. Only three went within five years (7.7% cf. 82% of all builders), fourteen lasted 11-20 years (35.9% cf. 7.4%) and twelve more than twenty years (30.8% cf. 2.5%). This reinforces the view that it was longevity rather than high annual output which produced large totals, and this almost certainly reflects the difficulty of raising large sums of money except in special cases.
Individual Builders
Little evidence is available to flesh out the bare statistical data. The Lathey brothers alone seem to have left any personal record.5 The Census provides some data on age and birthplace, but misses the great majority of transients, and does not even catch all those operating in the relevant years. Equally, it mentions “builders” of whom there is no trace locally. Alfred Heaver is discussed in Chapter 13. (See Appendix 3b for brief biographical notes on selected builders.)
Edwin Lathey was born at Berwick St. John, Wiltshire in 1832, and moved to Battersea Fields in Spring 1851 with his elder brother Samuel, born 1819. They were carpenters who turned to housebuilding. In 1859, they purchased some land from Mr. Greenaway, a market gardener-cum-laundryman in New Road. The site was fully planted with cabbages and spinach, which were sold to Fletcher, a local greengrocer. Work began in the autumn on 1-4 St. Georges Road. The mild winter meant that roofing-in took place in early Spring 1860. The total cost was £832, of which their father Robert contributed £330, Samuel £282, Edwin £100, and various other relatives the balance of £120. Edwin moved to No.1 in Summer 1860; 2 was let to Mr. Bray, engine driver at the waterworks and Wesleyan lay preacher; 3 was occupied by George Banks, a LSWR engine driver, and 4 was let to Charles Lucas. Edwin married in 1861 and moved to No.2.
In 1862, the Latheys successfully tendered for St. George’s vicarage, a £1,400 job, designed by Ewan Christian. Between 1862 and 1867, they built 43 houses, ranging from small cottages in Aegis Grove to substantial villas in Park Road, New Wandsworth. More public works – parochial schools in Chatham Street – followed in 1866. After 1870, they concentrated on work for the London School Board and the Metropolitan Police. Both brothers became Vestrymen. Edwin died in 1907, and his son took on the business. As with so many building firms, however, domestic troubles, including drunkenness, soon led to bankruptcy (1910). One of the firm’s last works was a mission room for St. Andrew’s behind 117-9 New Road (October 1908) – just a stone’s throw from their first work fifty years earlier.
Many men involved in building and development were Conservative supporters in the
p. 118election of 1868 – the first held under the Second Reform Act. They include Robert Anslow, George Bass, William Coomer, Charles Dungate, Samuel Everett, Joshua Kaley, Philip Knipler, Jesse Nickinson, Edward Pain, John Pearson, Christopher Todd, George Todd senior and junior, and John Trott.6
Finance
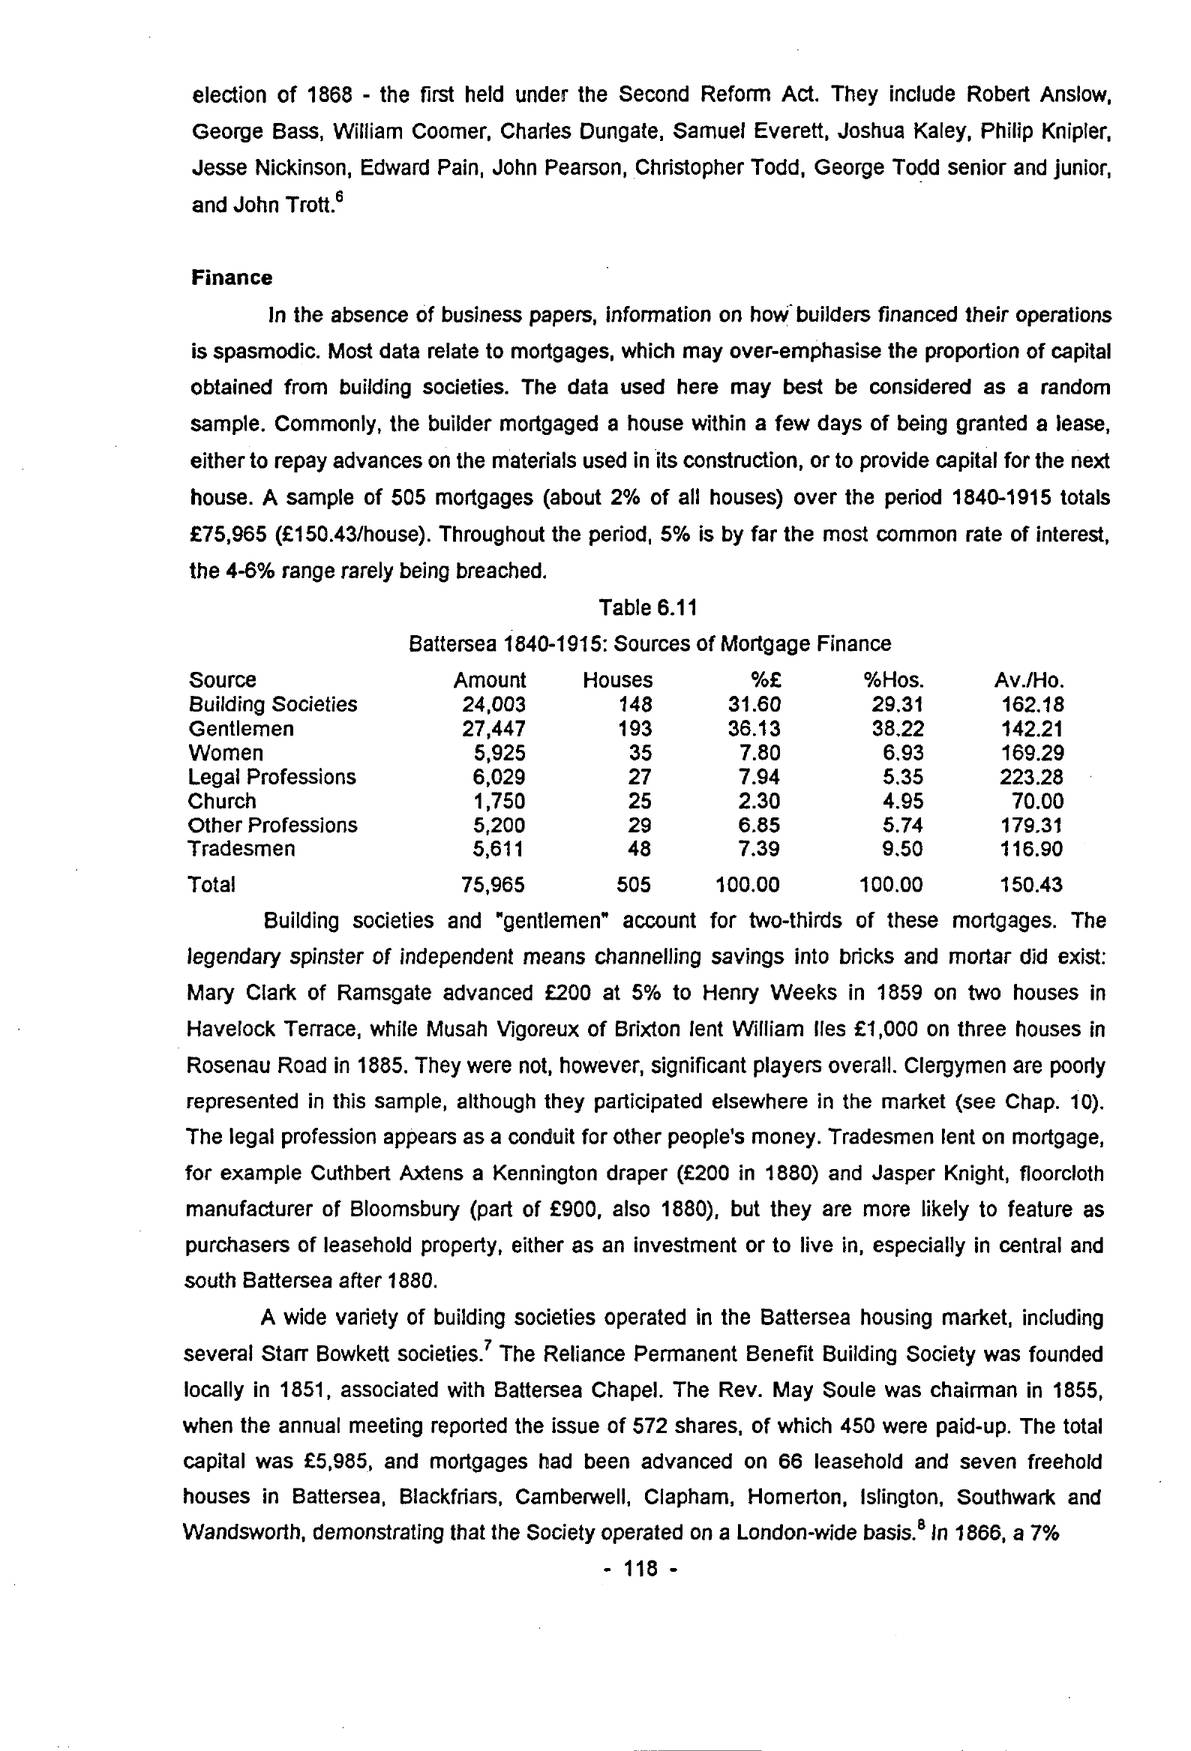
In the absence of business papers, information on how builders financed their operations is spasmodic. Most data relate to mortgages, which may over-emphasise the proportion of capital obtained from building societies. The data used here may best be considered as a random sample. Commonly, the builder mortgaged a house within a few days of being granted a lease, either to repay advances on the materials used in its construction, or to provide capital for the next house. A sample of 505 mortgages (about 2% of all houses) over the period 1840-1915 totals £75,965 (£150.43/house). Throughout the period, 5% is by far the most common rate of interest, the 4-6% range rarely being breached.
| Source | Amount | Houses | %£ | %Hos. | Av./Ho. |
|---|---|---|---|---|---|
| Building Societies | 24,003 | 148 | 31.60 | 29.31 | 162.18 |
| Gentlemen | 27,447 | 193 | 36.13 | 38.22 | 142.21 |
| Women | 5,925 | 35 | 7.80 | 6.93 | 169.29 |
| Legal Professions | 6,029 | 27 | 7.94 | 5.35 | 223.28 |
| Church | 1,750 | 25 | 2.30 | 4.95 | 70.00 |
| Other Professions | 5,200 | 29 | 6.85 | 5.74 | 179.31 |
| Tradesmen | 5,611 | 48 | 7.39 | 9.50 | 116.90 |
| Total | 75,965 | 505 | 100.00 | 100.00 | 150.43 |
Building societies and “gentlemen” account for two-thirds of these mortgages. The legendary spinster of independent means channelling savings into bricks and mortar did exist: Mary Clark of Ramsgate advanced £200 at 5% to Henry Weeks in 1859 on two houses in Havelock Terrace, while Musah Vigoreux of Brixton lent William Iles £1,000 on three houses in Rosenau Road in 1885. They were not, however, significant players overall. Clergymen are poorly represented in this sample, although they participated elsewhere in the market (see Chap. 10). The legal profession appears as a conduit for other people’s money. Tradesmen lent on mortgage, for example Cuthbert Axtens a Kennington draper (£200 in 1880) and Jasper Knight, floorcloth manufacturer of Bloomsbury (part of £900, also 1880), but they are more likely to feature as purchasers of leasehold property, either as an investment or to live in, especially in central and south Battersea after 1880.
A wide variety of building societies operated in the Battersea housing market, including several Starr Bowkett societies.7 The Reliance Permanent Benefit Building Society was founded locally in 1851, associated with Battersea Chapel. The Rev. May Soule was chairman in 1855, when the annual meeting reported the issue of 572 shares, of which 450 were paid-up. The total capital was £5,985, and mortgages had been advanced on 66 leasehold and seven freehold houses in Battersea, Blackfriars, Camberwell, Clapham, Homerton, Islington, Southwark and Wandsworth, demonstrating that the Society operated on a London-wide basis.8 In 1866, a 7%
p. 119dividend was declared, and £24,913 had been advanced on £60,000 worth of freehold and leasehold property.9 Societies usually lent on the basis of the number of shares held by the member. In 1868/9 the Civil Service Benefit B.S. lent £1,060 to Henry Jinks at £20/share, while in 1880 the London & Suburban General Permanent B.B.S. was much more generous to George Evans, lending £50/share at only 4%. Other institutions lending to local builders included the St. George Hanover Square Investment Association (£290 to John Drinkwater on two houses in Maysoule Rd., 1881), and the National Temperance Land & Building Co. Ltd. (£275 to Frederick Swinford on two houses in Tidemore St., 1869). The Conservative Benefit B.S. featured on the estates of its sister land society, as did the National Freehold Land Co. on its schemes. Although the amounts are not specified, architect/developer William Pocock advanced bricks and materials to builders on his Falcon Lane estate at 5%, making handsome returns: “in helping others, I helped myself”, a fitting epitaph for any Victorian entrepreneur.10 Only one loan involving a building supply firm has been noted. In 1868, Pickworth & Sharp, brick and tile merchants of Nine Elms, loaned Isaac Kerridge £446 at 5% on 108-112 Livingstone Road.11
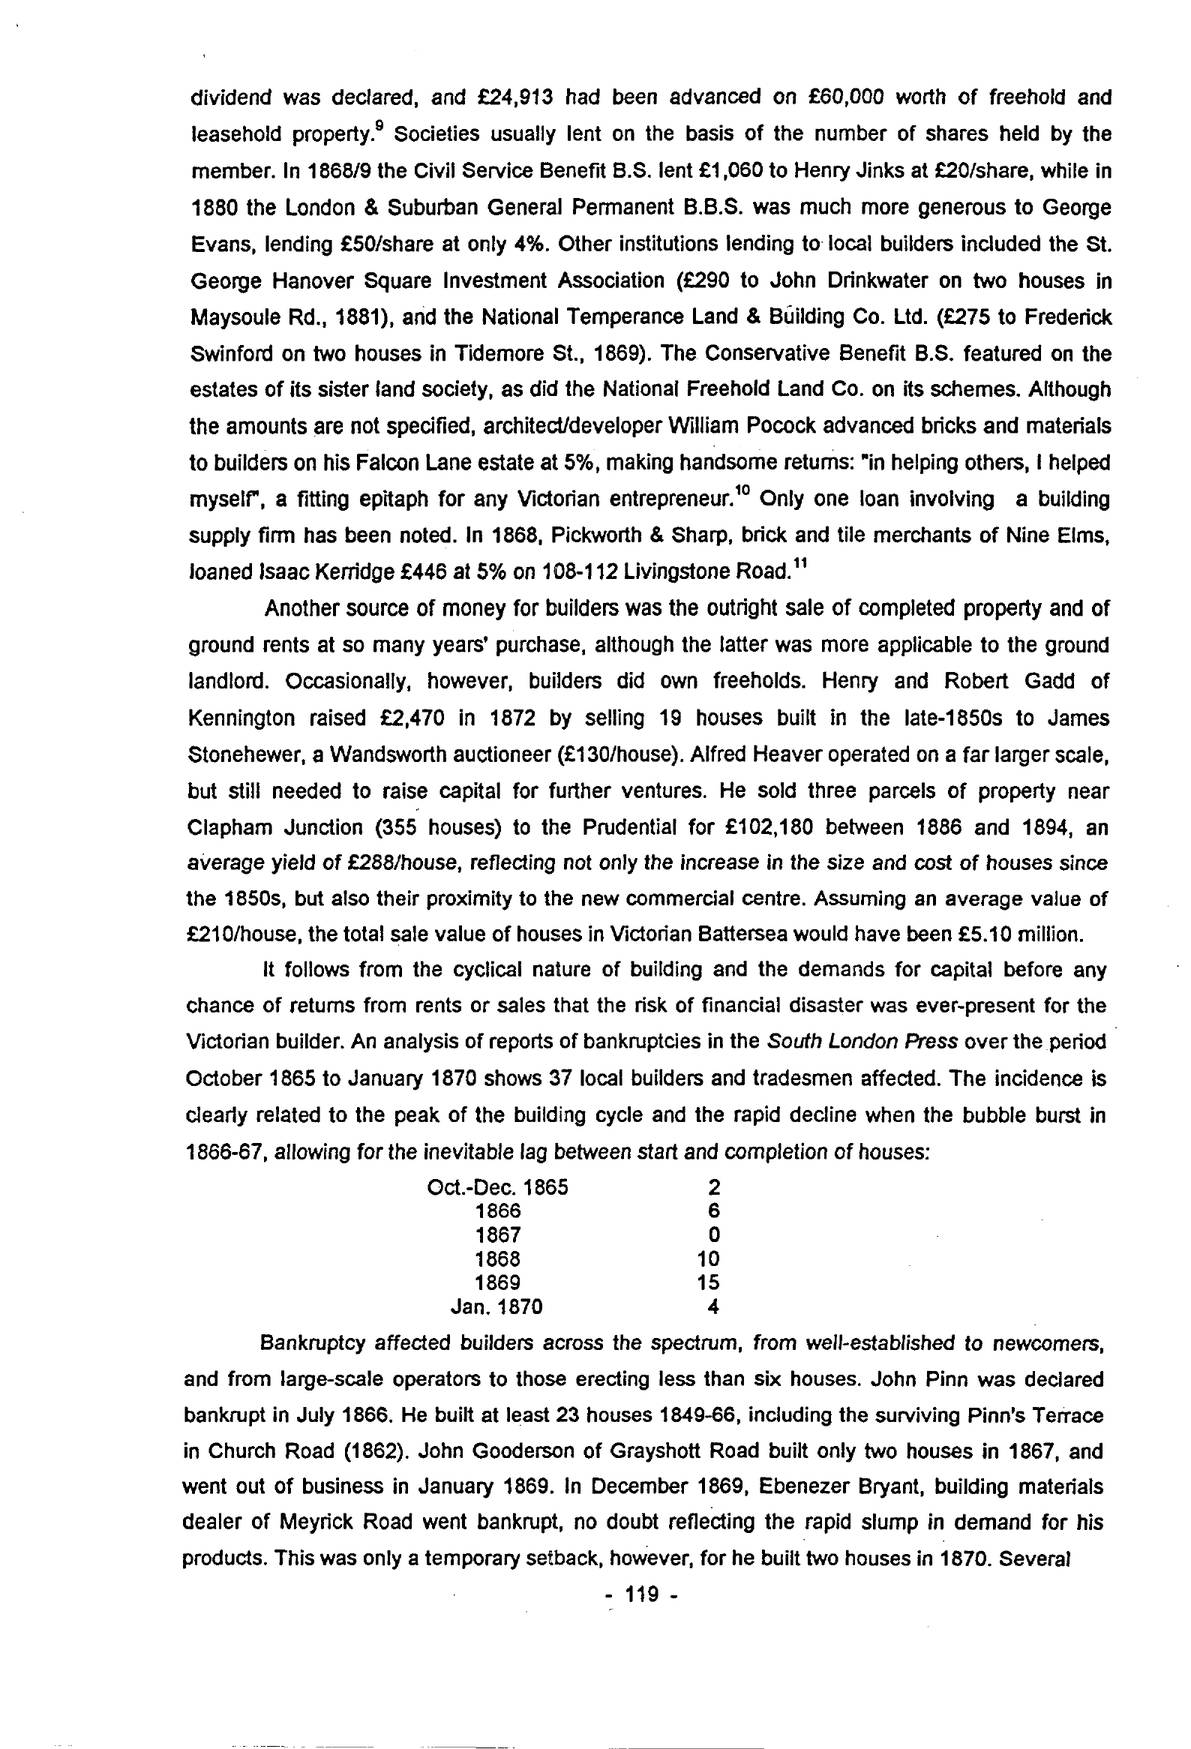
Another source of money for builders was the outright sale of completed property and of ground rents at so many years’ purchase, although the latter was more applicable to the ground landlord. Occasionally, however, builders did own freeholds. Henry and Robert Gadd of Kennington raised £2,470 in 1872 by selling 19 houses built in the late-1850s to James Stonehewer, a Wandsworth auctioneer (£130/house). Alfred Heaver operated on a far larger scale, but still needed to raise capital for further ventures. He sold three parcels of property near Clapham Junction (355 houses) to the Prudential for £102,180 between 1886 and 1894, an average yield of £288/house, reflecting not only the increase in the size and cost of houses since the 1850s, but also their proximity to the new commercial centre. Assuming an average value of £210/house, the total sale value of houses in Victorian Battersea would have been £5.10 million.
It follows from the cyclical nature of building and the demands for capital before any chance of returns from rents or sales that the risk of financial disaster was ever-present for the Victorian builder. An analysis of reports of bankruptcies in the South London Press over the period October 1865 to January 1870 shows 37 local builders and tradesmen affected. The incidence is clearly related to the peak of the building cycle and the rapid decline when the bubble burst in 1866-67, allowing for the inevitable lag between start and completion of houses:
| Oct.-Dec. 1865 | 2 |
| 1866 | 6 |
| 1867 | 0 |
| 1868 | 10 |
| 1869 | 15 |
| Jan. 1870 | 4 |
Bankruptcy affected builders across the spectrum, from well-established to newcomers, and from large-scale operators to those erecting less than six houses. John Pinn was declared bankrupt in July 1866. He built at least 23 houses 1849-66, including the surviving Pinn’s Terrace in Church Road (1862). John Gooderson of Grayshott Road built only two houses in 1867, and went out of business in January 1869. In December 1869, Ebenezer Bryant, building materials dealer of Meyrick Road went bankrupt, no doubt reflecting the rapid slump in demand for his products. This was only a temporary setback, however, for he built two houses in 1870. Several
p. 120builders returned after bankruptcy in the late-1860s: William Mulliner of Wandsworth (eight houses 1862-66, bankrupt August 1868, reappeared 1877); William Thornton of Battersea Rise (41 houses 1847-69, bankrupt February 1869, built six houses in Wandsworth 1870-76) and Frederick Swinford of Tidemore Street (bankrupt December 1869, built 25 houses 1871-4).
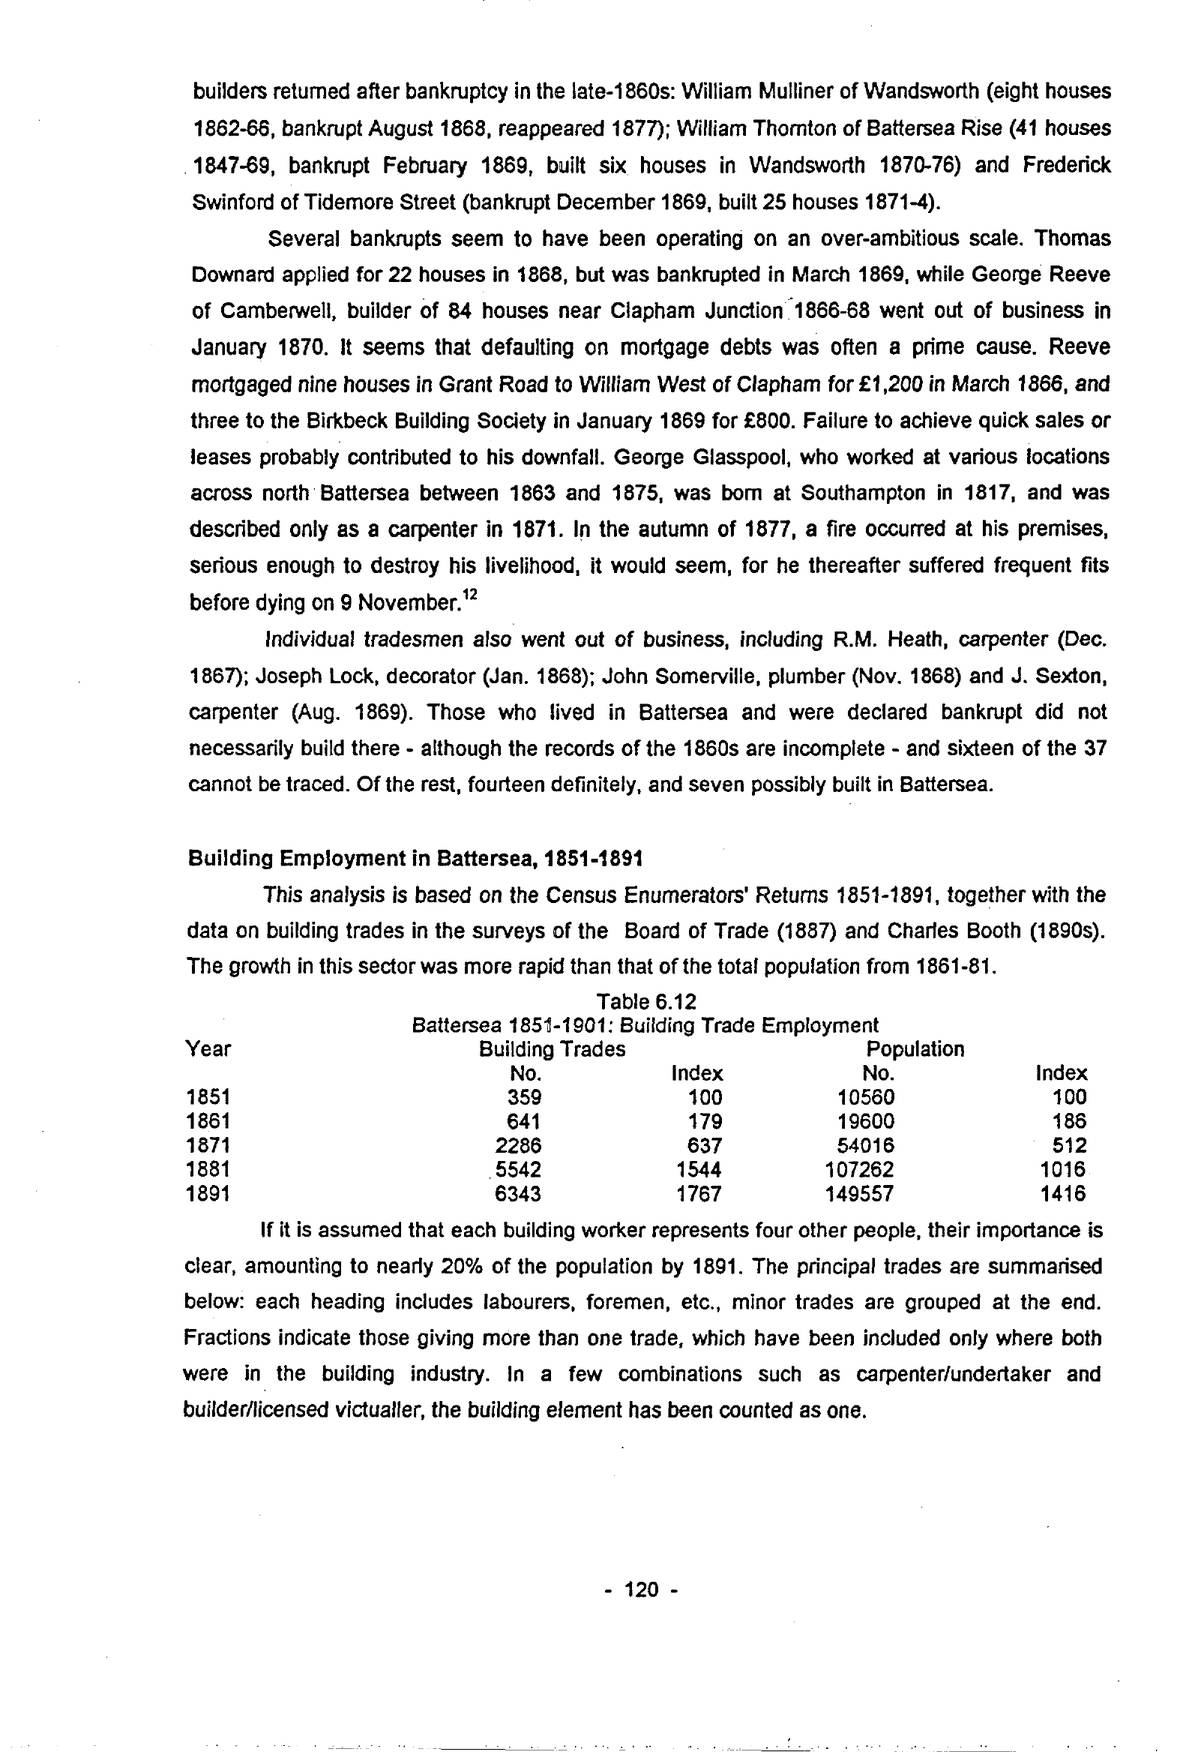
Several bankrupts seem to have been operating on an over-ambitious scale. Thomas Downard applied for 22 houses in 1868, but was bankrupted in March 1869, while George Reeve of Camberwell, builder of 84 houses near Clapham Junction 1866-68 went out of business in January 1870. It seems that defaulting on mortgage debts was often a prime cause. Reeve mortgaged nine houses in Grant Road to William West of Clapham for £1,200 in March 1866, and three to the Birkbeck Building Society in January 1869 for £800. Failure to achieve quick sales or leases probably contributed to his downfall. George Glasspool, who worked at various locations across north Battersea between 1863 and 1875, was born at Southampton in 1817, and was described only as a carpenter in 1871. In the autumn of 1877, a fire occurred at his premises, serious enough to destroy his livelihood, it would seem, for he thereafter suffered frequent fits before dying on 9 November.12
Individual tradesmen also went out of business, including R.M. Heath, carpenter (Dec. 1867); Joseph Lock, decorator (Jan. 1868); John Somerville, plumber (Nov. 1868) and J. Sexton, carpenter (Aug. 1869). Those who lived in Battersea and were declared bankrupt did not necessarily build there – although the records of the 1860s are incomplete – and sixteen of the 37 cannot be traced. Of the rest, fourteen definitely, and seven possibly built in Battersea.
Building Employment in Battersea, 1851-1891
This analysis is based on the Census Enumerators’ Returns 1851-1891, together with the data on building trades in the surveys of the Board of Trade (1887) and Charles Booth (1890s). The growth in this sector was more rapid than that of the total population from 1861-81.
| Year | Building Trades | Population | ||
|---|---|---|---|---|
| No. | Index | No. | Index | |
| 1851 | 359 | 100 | 10560 | 100 |
| 1861 | 641 | 179 | 19600 | 186 |
| 1871 | 2286 | 637 | 54016 | 512 |
| 1881 | 5542 | 1544 | 107262 | 1016 |
| 1891 | 6343 | 1767 | 149557 | 1416 |
If it is assumed that each building worker represents four other people, their importance is clear, amounting to nearly 20% of the population by 1891. The principal trades are summarised below: each heading includes labourers, foremen, etc., minor trades are grouped at the end. Fractions indicate those giving more than one trade, which have been included only where both were in the building industry. In a few combinations such as carpenter/undertaker and builder/licensed victualler, the building element has been counted as one.
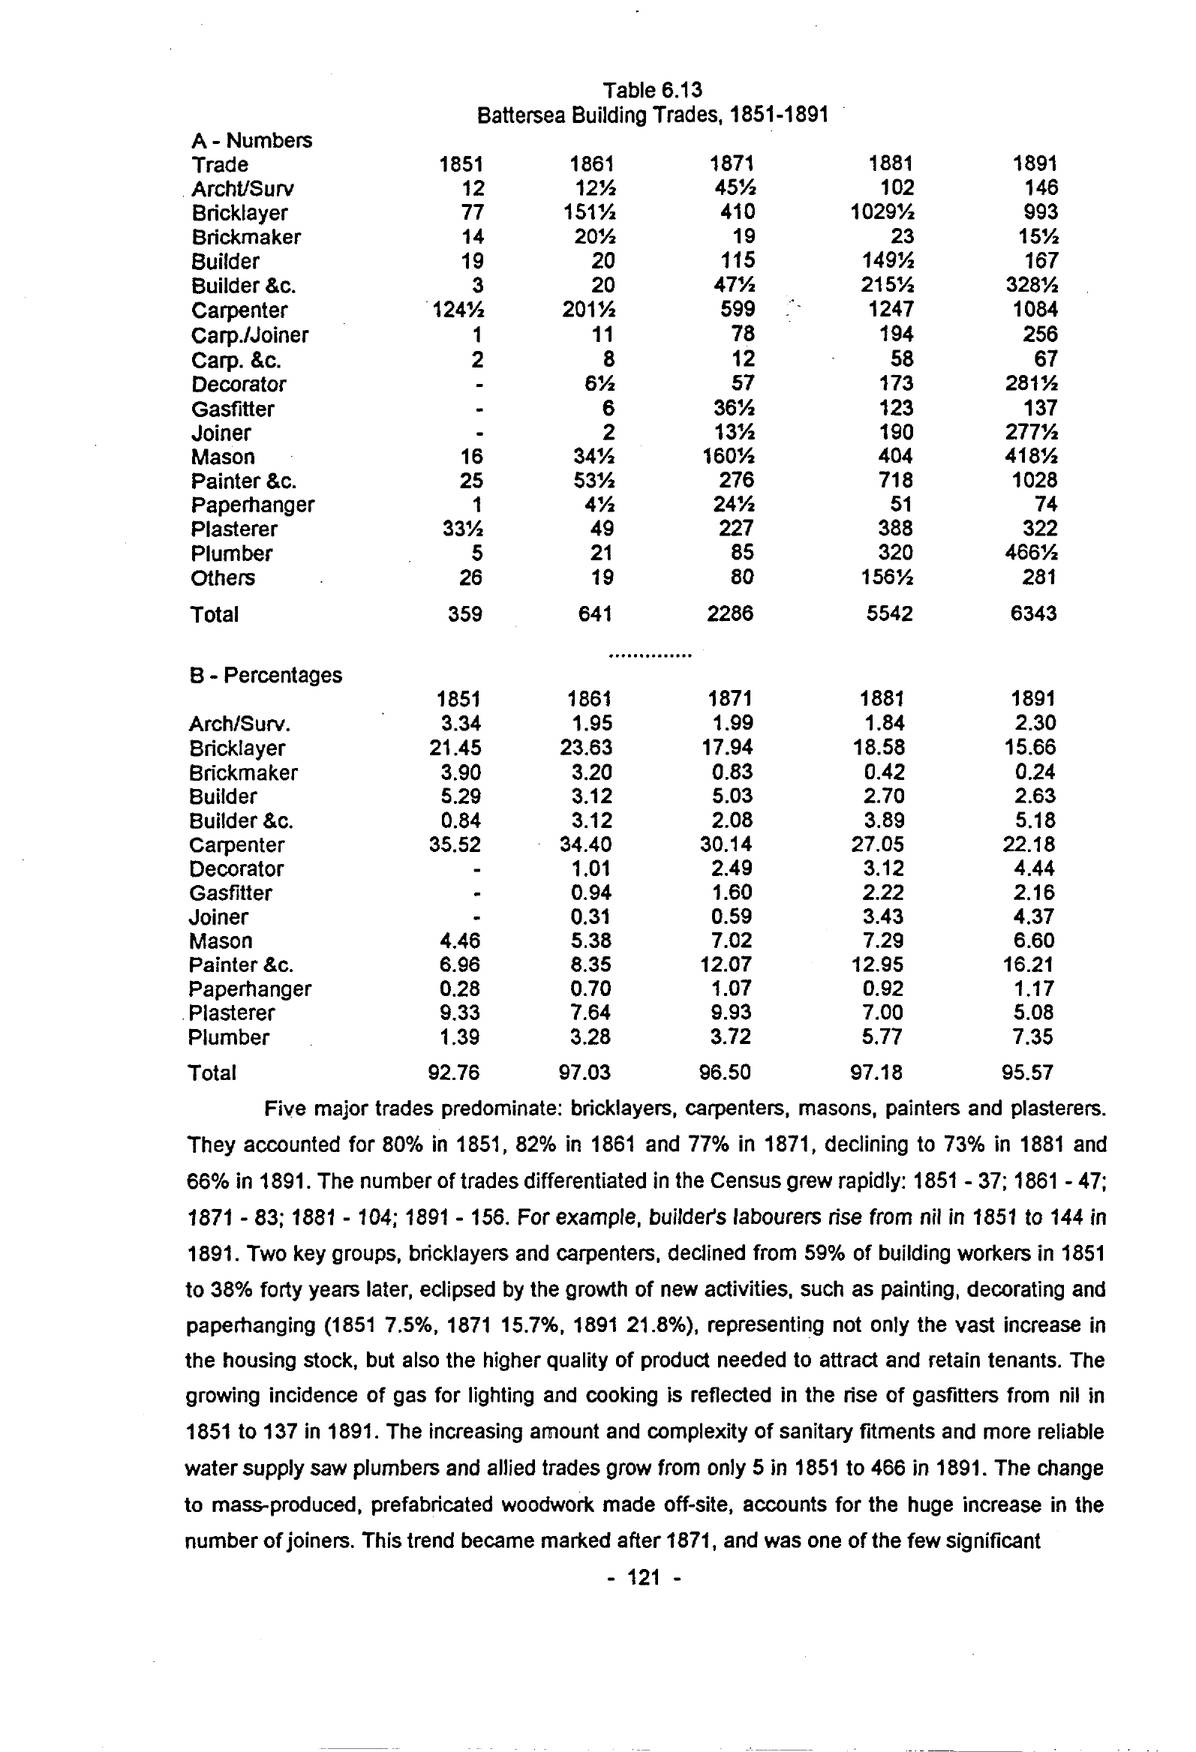
| A – Numbers | |||||
|---|---|---|---|---|---|
| Trade | 1851 | 1861 | 1871 | 1881 | 1891 |
| Archt/Surv | 12 | 12½ | 45½ | 102 | 146 |
| Bricklayer | 77 | 151½ | 410 | 1029½ | 993 |
| Brickmaker | 14 | 20½ | 19 | 23 | 15½ |
| Builder | 19 | 20 | 115 | 149½ | 167 |
| Builder &c. | 3 | 20 | 47½ | 215½ | 328½ |
| Carpenter | 124½ | 201½ | 599 | 1247 | 1084 |
| Carp./Joiner | 1 | 11 | 78 | 194 | 256 |
| Carp. &c. | 2 | 8 | 12 | 58 | 67 |
| Decorator | - | 6½ | 57 | 173 | 281½ |
| Gasfitter | - | 6 | 36½ | 123 | 137 |
| Joiner | - | 2 | 13½ | 190 | 277½ |
| Mason | 16 | 34½ | 160½ | 404 | 418½ |
| Painter &c. | 25 | 53½ | 276 | 718 | 1028 |
| Paperhanger | 1 | 4½ | 24½ | 51 | 74 |
| Plasterer | 33½ | 49 | 227 | 388 | 322 |
| Plumber | 5 | 21 | 85 | 320 | 466½ |
| Others | 26 | 19 | 80 | 156½ | 281 |
| Total | 359 | 641 | 2286 | 5542 | 6343 |
| B – Percentages | |||||
| 1851 | 1861 | 1871 | 1881 | 1891 | |
| Arch/Surv. | 3.34 | 1.95 | 1.99 | 1.84 | 2.30 |
| Bricklayer | 21.45 | 23.63 | 17.94 | 18.58 | 15.66 |
| Brickmaker | 3.90 | 3.20 | 0.83 | 0.42 | 0.24 |
| Builder | 5.29 | 3.12 | 5.03 | 2.70 | 2.63 |
| Builder &c. | 0.84 | 3.12 | 2.08 | 3.89 | 5.18 |
| Carpenter | 35.52 | 34.40 | 30.14 | 27.05 | 22.18 |
| Decorator | - | 1.01 | 2.49 | 3.12 | 4.44 |
| Gasfitter | - | 0.94 | 1.60 | 2.22 | 2.16 |
| Joiner | - | 0.31 | 0.59 | 3.43 | 4.37 |
| Mason | 4.46 | 5.38 | 7.02 | 7.29 | 6.60 |
| Painter &c. | 6.96 | 8.35 | 12.07 | 12.95 | 16.21 |
| Paperhanger | 0.28 | 0.70 | 1.07 | 0.92 | 1.17 |
| Plasterer | 9.33 | 7.64 | 9.93 | 7.00 | 5.08 |
| Plumber | 1.39 | 3.28 | 3.72 | 5.77 | 7.35 |
| Total | 92.76 | 97.03 | 96.50 | 97.18 | 95.57 |
Five major trades predominate: bricklayers, carpenters, masons, painters and plasterers. They accounted for 80% in 1851, 82% in 1861 and 77% in 1871, declining to 73% in 1881 and 66% in 1891. The number of trades differentiated in the Census grew rapidly: 1851 – 37; 1861 – 47; 1871 – 83; 1881 – 104; 1891 – 156. For example, builder’s labourers rise from nil in 1851 to 144 in 1891. Two key groups, bricklayers and carpenters, declined from 59% of building workers in 1851 to 38% forty years later, eclipsed by the growth of new activities, such as painting, decorating and paperhanging (1851 7.5%, 1871 15.7%, 1891 21.8%), representing not only the vast increase in the housing stock, but also the higher quality of product needed to attract and retain tenants. The growing incidence of gas for lighting and cooking is reflected in the rise of gasfitters from nil in 1851 to 137 in 1891. The increasing amount and complexity of sanitary fitments and more reliable water supply saw plumbers and allied trades grow from only 5 in 1851 to 466 in 1891. The change to mass-produced, prefabricated woodwork made off-site, accounts for the huge increase in the number of joiners. This trend became marked after 1871, and was one of the few significant
p. 122changes in working practices in Victorian housebuilding.
The number of architects, surveyors and allied professionals kept pace with the rise in the building industry, although most of their work would have been outside Battersea. The same is not, however, true of two vital activities – the supply of materials and work on roofing. Except for bricks, some of which were locally made, all of the materials required for the thousands of houses and other buildings and structures in Victorian Battersea had to be obtained from elsewhere. And yet, not only the Census, but also street and trade directories record very few suppliers locally. Taking builder’s, cement, stone and timber merchants, the numbers were always an insignificant and diminishing element : 1851 – 12; 1861 – 12½; 1871 – 33; 1881 – 26; 1891 – 66½. This activity was mainly on wharves along the Thames and most of these men worked as labourers, carters and so on.
Much more difficult to explain is the dearth of slaters and tilers. Apart from the London & North Western Railway’s Falcon Lane Depot, opened in 1869, the means by which millions of Welsh and other slates reached Battersea are obscure. Some no doubt came to local wharves by coastal ships. The tiny handful of slaters mentioned 1851-1871 cannot have kept pace with demand in the 1860s boom, and even as late as 1891 there were only 40. Given the amount of timber which formed the basis of every roof, some carpenters may also have hung slates and tiles, as may some masons.
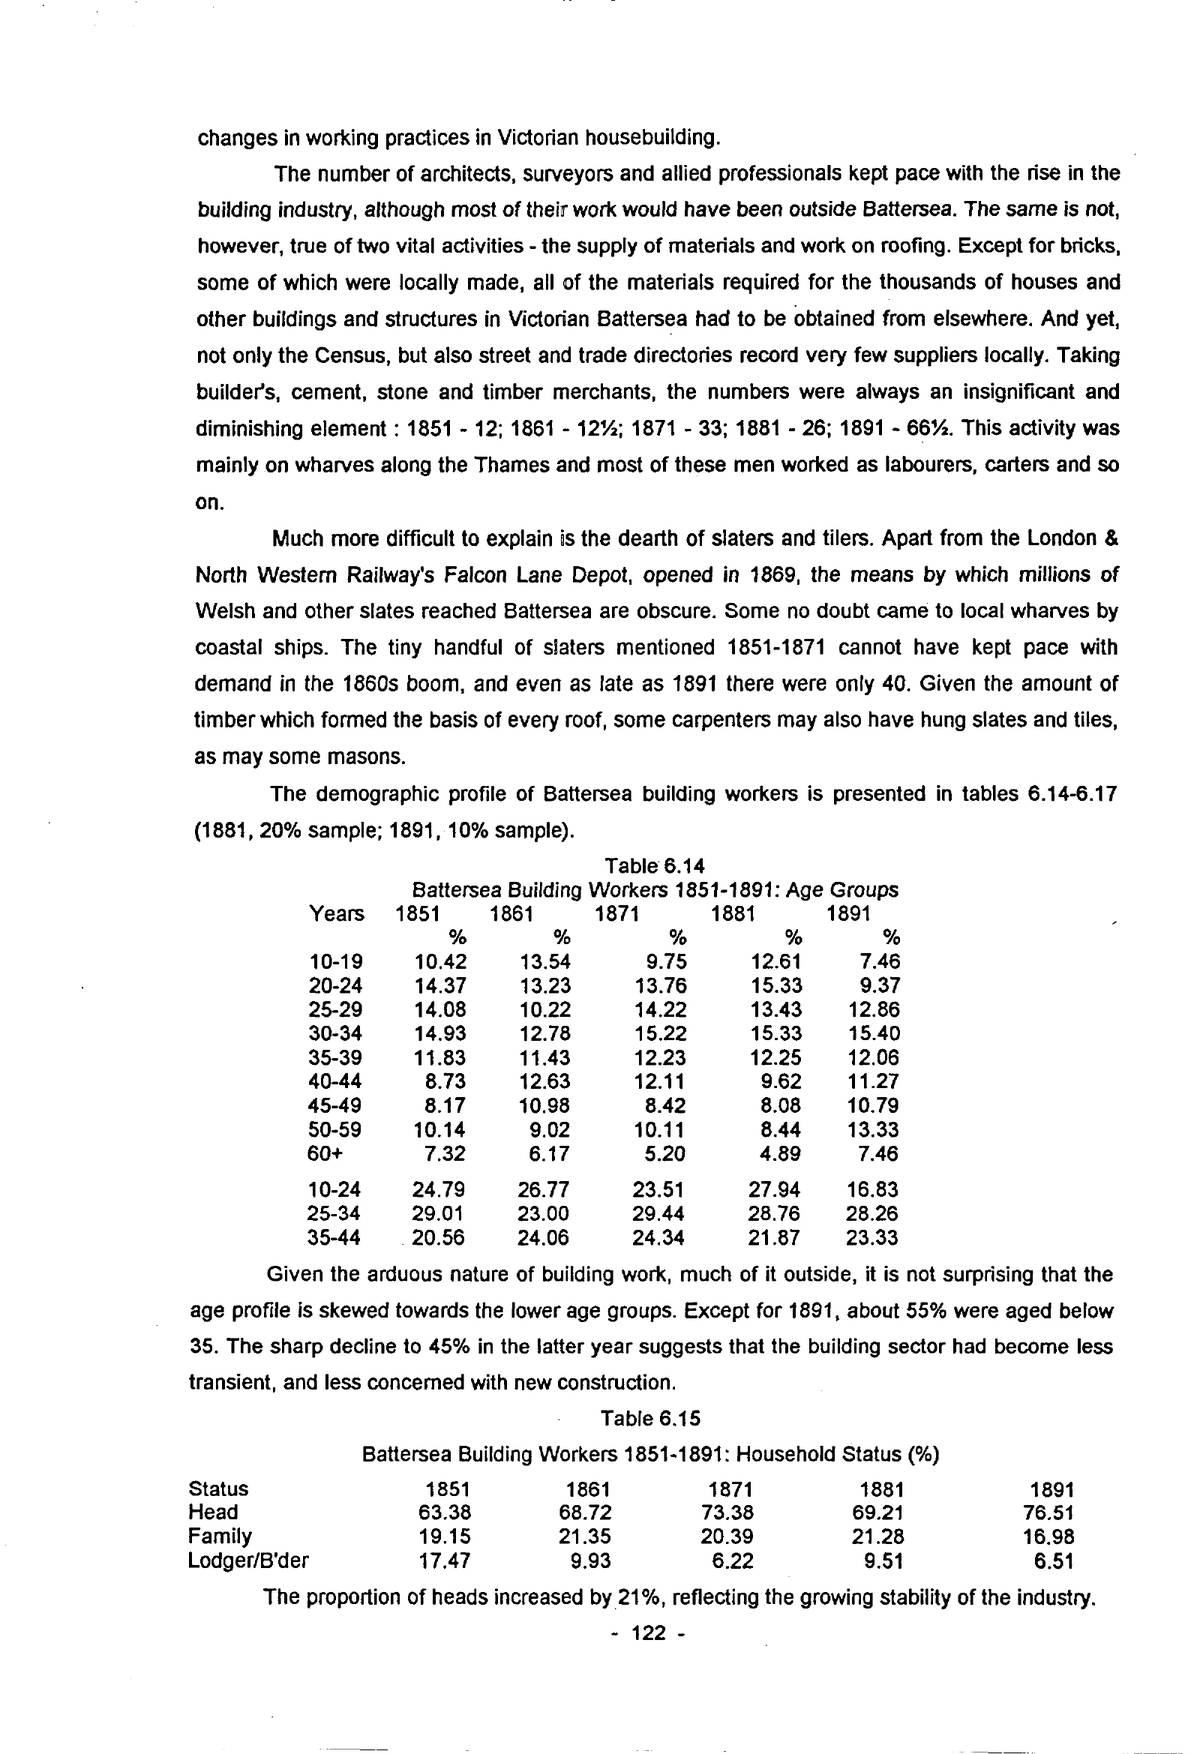
The demographic profile of Battersea building workers is presented in tables 6.14-6.17 (1881, 20% sample; 1891, 10% sample).
| Years | 1851 | 1861 | 1871 | 1881 | 1891 |
|---|---|---|---|---|---|
| % | % | % | % | % | |
| 10-19 | 10.42 | 13.54 | 9.75 | 12.61 | 7.46 |
| 20-24 | 14.37 | 13.23 | 13.76 | 15.33 | 9.37 |
| 25-29 | 14.08 | 10.22 | 14.22 | 13.43 | 12.86 |
| 30-34 | 14.93 | 12.78 | 15.22 | 15.33 | 15.40 |
| 35-39 | 11.83 | 11.43 | 12.23 | 12.25 | 12.06 |
| 40-44 | 8.73 | 12.63 | 12.11 | 9.62 | 11.27 |
| 45-49 | 8.17 | 10.98 | 8.42 | 8.08 | 10.79 |
| 50-59 | 10.14 | 9.02 | 10.11 | 8.44 | 13.33 |
| 60+ | 7.32 | 6.17 | 5.20 | 4.89 | 7.46 |
| 10-24 | 24.79 | 26.77 | 23.51 | 27.94 | 16.83 |
| 25-34 | 29.01 | 23.00 | 29.44 | 28.76 | 28.26 |
| 35-44 | 20.56 | 24.06 | 24.34 | 21.87 | 23.33 |
Given the arduous nature of building work, much of it outside, it is not surprising that the age profile is skewed towards the lower age groups. Except for 1891, about 55% were aged below 35. The sharp decline to 45% in the latter year suggests that the building sector had become less transient, and less concerned with new construction.
| Status | 1851 | 1861 | 1871 | 1881 | 1891 |
|---|---|---|---|---|---|
| Head | 63.38 | 68.72 | 73.38 | 69.21 | 76.51 |
| Family | 19.15 | 21.35 | 20.39 | 21.28 | 16.98 |
| Lodger/B’der | 17.47 | 9.93 | 6.22 | 9.51 | 6.51 |
The proportion of heads increased by 21%, reflecting the growing stability of the industry.
Open zoomable view
p. 124This was matched by an erratic fall of about 20% in family members after 1861. The number of lodgers and boarders changed much more dramatically, however, falling by 43% in the 1850s and 38% in the 1860s. The rise in 1881 reflects the intensity of building activity at that time, and probably a relative shortage of houses. The pattern in 1891 is that of the mature suburb.
| Status | 1851 | 1861 | 1871 | 1881 | 1891 |
|---|---|---|---|---|---|
| Single | 28.45 | 31.13 | 23.38 | 28.01 | 21.11 |
| [Heads | 0 | 4.81 | 0.84 | 0.73 | 1.24 |
| [Family | 89.71 | 93.66 | 88.55 | 92.10 | 91.26 |
| [Lo/Bdr | 64.52 | 78.79 | 75.66 | 83.90 | 73.33 |
| Married | 66.76 | 64.96 | 73.01 | 69.10 | 74.13 |
| [Heads | 95.11 | 91.68 | 95.98 | 96.49 | 94.61 |
| [Family | 4.41 | 3.52 | 8.63 | 6.63 | 6.80 |
| [Lo/Bdr | 32.26 | 12.12 | 13.16 | 9.66 | 8.89 |
| Widowed | 4.79 | 3.91 | 3.60 | 2.88 | 4.76 |
| [Heads | 4.89 | 3.50 | 3.18 | 2.79 | 4.15 |
| [Family | 5.88 | 2.82 | 2.81 | 1.61 | 1.94 |
| [Lo/Bdr | 3.23 | 9.09 | 11.18 | 6.44 | 17.78 |
Most single workers were family members, usually sons or brothers, or lodgers/boarders. Apart from 1861, unmarried household heads are virtually absent, since a certain economic position was necessary before contemplating marriage, often in the late-twenties. Overall, 65-75% were married, but for household heads the proportion was 90-95%. Except in 1851, few lodgers and boarders were married. Many who were lived alone, their wives and families supported by remittances. Only 3-5% were widowed, mainly elderly relatives, and a few household heads. The proportion among lodgers/boarders was higher, rising sharply to 18% in 1891.
| Parish/County | 1851 | 1861 | 1871 | 1881 | 1891 |
|---|---|---|---|---|---|
| Battersea | 12.78 | 8.47 | 5.60 | 6.53 | 8.93 |
| Adjacent Gp.1 | 8.52 | 7.41 | 4.68 | 3.47 | 4.23 |
| Adjacent Gp.2 | 7.67 | 10.14 | 14.81 | 15.20 | 16.93 |
| Lamb/Swark/Cambl | 6.53 | 5.30 | 7.33 | 7.29 | 4.86 |
| Central London | 4.83 | 4.39 | 3.29 | 4.22 | 4.55 |
| Rest of Surrey | 4.55 | 7.26 | 4.49 | 3.58 | 2.82 |
| Rest of Middx. | 4.55 | 4.84 | 7.04 | 7.64 | 6.90 |
| Total Surrey/Middx. | 49.43 | 47.81 | 47.24 | 47.94 | 49.22 |
| Home Counties | 20.44 | 19.65 | 18.27 | 17.88 | 19.12 |
| East Anglia | 6.25 | 7.25 | 6.62 | 6.33 | 6.74 |
| East Midlands | 1.42 | 1.96 | 2.01 | 2.02 | 2.82 |
| West Midlands | 4.25 | 6.51 | 7.05 | 5.66 | 5.48 |
| South West | 9.66 | 9.69 | 10.61 | 10.71 | 10.34 |
| North West | 0.85 | 1.05 | 1.30 | 1.31 | 0.47 |
| North East | 0.85 | 1.36 | 1.98 | 2.13 | 1.57 |
| Wales | 1.14 | 0.45 | 0.87 | 0.87 | 0.94 |
| Scotland | 0.85 | 0.76 | 1.23 | 2.29 | 1.72 |
| Ireland | 3.69 | 2.57 | 1.73 | 1.53 | 0.78 |
| Overseas/Unknown | 0.89 | 0.79 | 0.97 | 1.06 | 0.80 |
Note: Adjacent Gp.1 – Wandsworth/Clapham/Fulham/Putney
Adjacent Gp.2 – Chelsea/Pimlico/Westminster
Home Counties – Bucks/Sussex/Kent/Berks/Herts/Beds/Essex/Oxon/Hants/IoW
East Anglia – Suff/Norf/Cambs/Hunts
East Midlands – Derby/Notts/Lincs/Leics/Rutl
West Midlands – Warw/Worcs/Heref/Salop/Staffs/Glos/Northants
p. 125South West – Wilts/Dorset/Som/Devon/Corn
North West – Ches/Lancs/Cumb/Westmld
North East – Yorks/Durh/Nbld
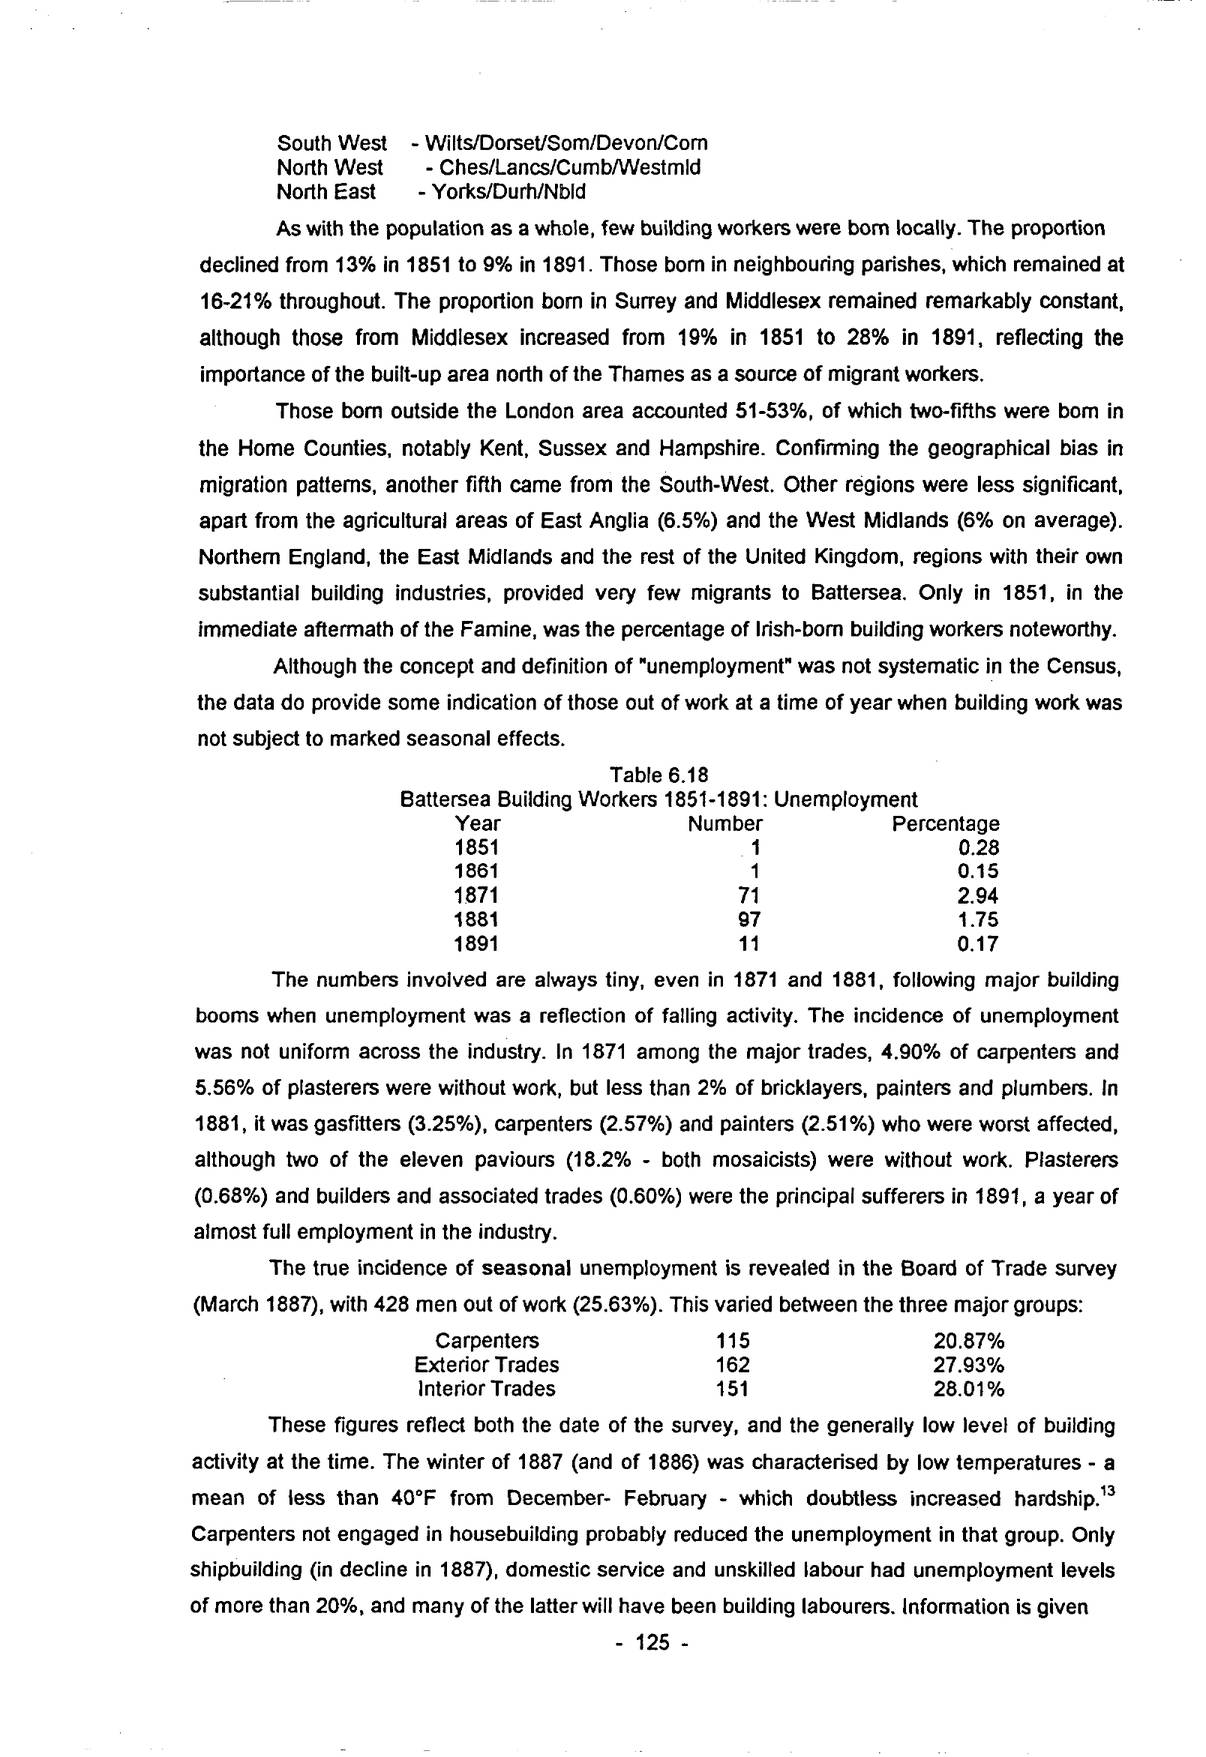
As with the population as a whole, few building workers were born locally. The proportion declined from 13% in 1851 to 9% in 1891. Those born in neighbouring parishes, which remained at 16-21% throughout. The proportion born in Surrey and Middlesex remained remarkably constant, although those from Middlesex increased from 19% in 1851 to 28% in 1891, reflecting the importance of the built-up area north of the Thames as a source of migrant workers.
Those born outside the London area accounted 51-53%, of which two-fifths were born in the Home Counties, notably Kent, Sussex and Hampshire. Confirming the geographical bias in migration patterns, another fifth came from the South-West. Other regions were less significant, apart from the agricultural areas of East Anglia (6.5%) and the West Midlands (6% on average). Northern England, the East Midlands and the rest of the United Kingdom, regions with their own substantial building industries, provided very few migrants to Battersea. Only in 1851, in the immediate aftermath of the Famine, was the percentage of Irish-born building workers noteworthy.
Although the concept and definition of “unemployment” was not systematic in the Census, the data do provide some indication of those out of work at a time of year when building work was not subject to marked seasonal effects.
| Year | Number | Percentage |
|---|---|---|
| 1851 | 1 | 0.28 |
| 1861 | 1 | 0.15 |
| 1871 | 71 | 2.94 |
| 1881 | 97 | 1.75 |
| 1891 | 11 | 0.17 |
The numbers involved are always tiny, even in 1871 and 1881, following major building booms when unemployment was a reflection of falling activity. The incidence of unemployment was not uniform across the industry. In 1871 among the major trades, 4.90% of carpenters and 5.56% of plasterers were without work, but less than 2% of bricklayers, painters and plumbers. In 1881, it was gasfitters (3.25%), carpenters (2.57%) and painters (2.51%) who were worst affected, although two of the eleven paviours (18.2% – both mosaicists) were without work. Plasterers (0.68%) and builders and associated trades (0.60%) were the principal sufferers in 1891, a year of almost full employment in the industry.
The true incidence of seasonal unemployment is revealed in the Board of Trade survey (March 1887), with 428 men out of work (25.63%). This varied between the three major groups:
| Carpenters | 115 | 20.87% |
| Exterior Trades | 162 | 27.93% |
| Interior Trades | 151 | 28.01% |
These figures reflect both the date of the survey, and the generally low level of building activity at the time. The winter of 1887 (and of 1886) was characterised by low temperatures – a mean of less than 40°F from December- February – which doubtless increased hardship.13 Carpenters not engaged in housebuilding probably reduced the unemployment in that group. Only shipbuilding (in decline in 1887), domestic service and unskilled labour had unemployment levels of more than 20%, and many of the latter will have been building labourers. Information is given
p. 126on the duration of unemployment since 31 October 1886:
| Weeks | Carpenters | Exterior | Interior |
|---|---|---|---|
| <4 | 3.54 | 5.30 | 4.00 |
| 4-8 | 17.70 | 10.60 | 4.67 |
| 8-12 | 15.93 | 5.96 | 10.00 |
| >12 | 62.83 | 78.14 | 81.33 |
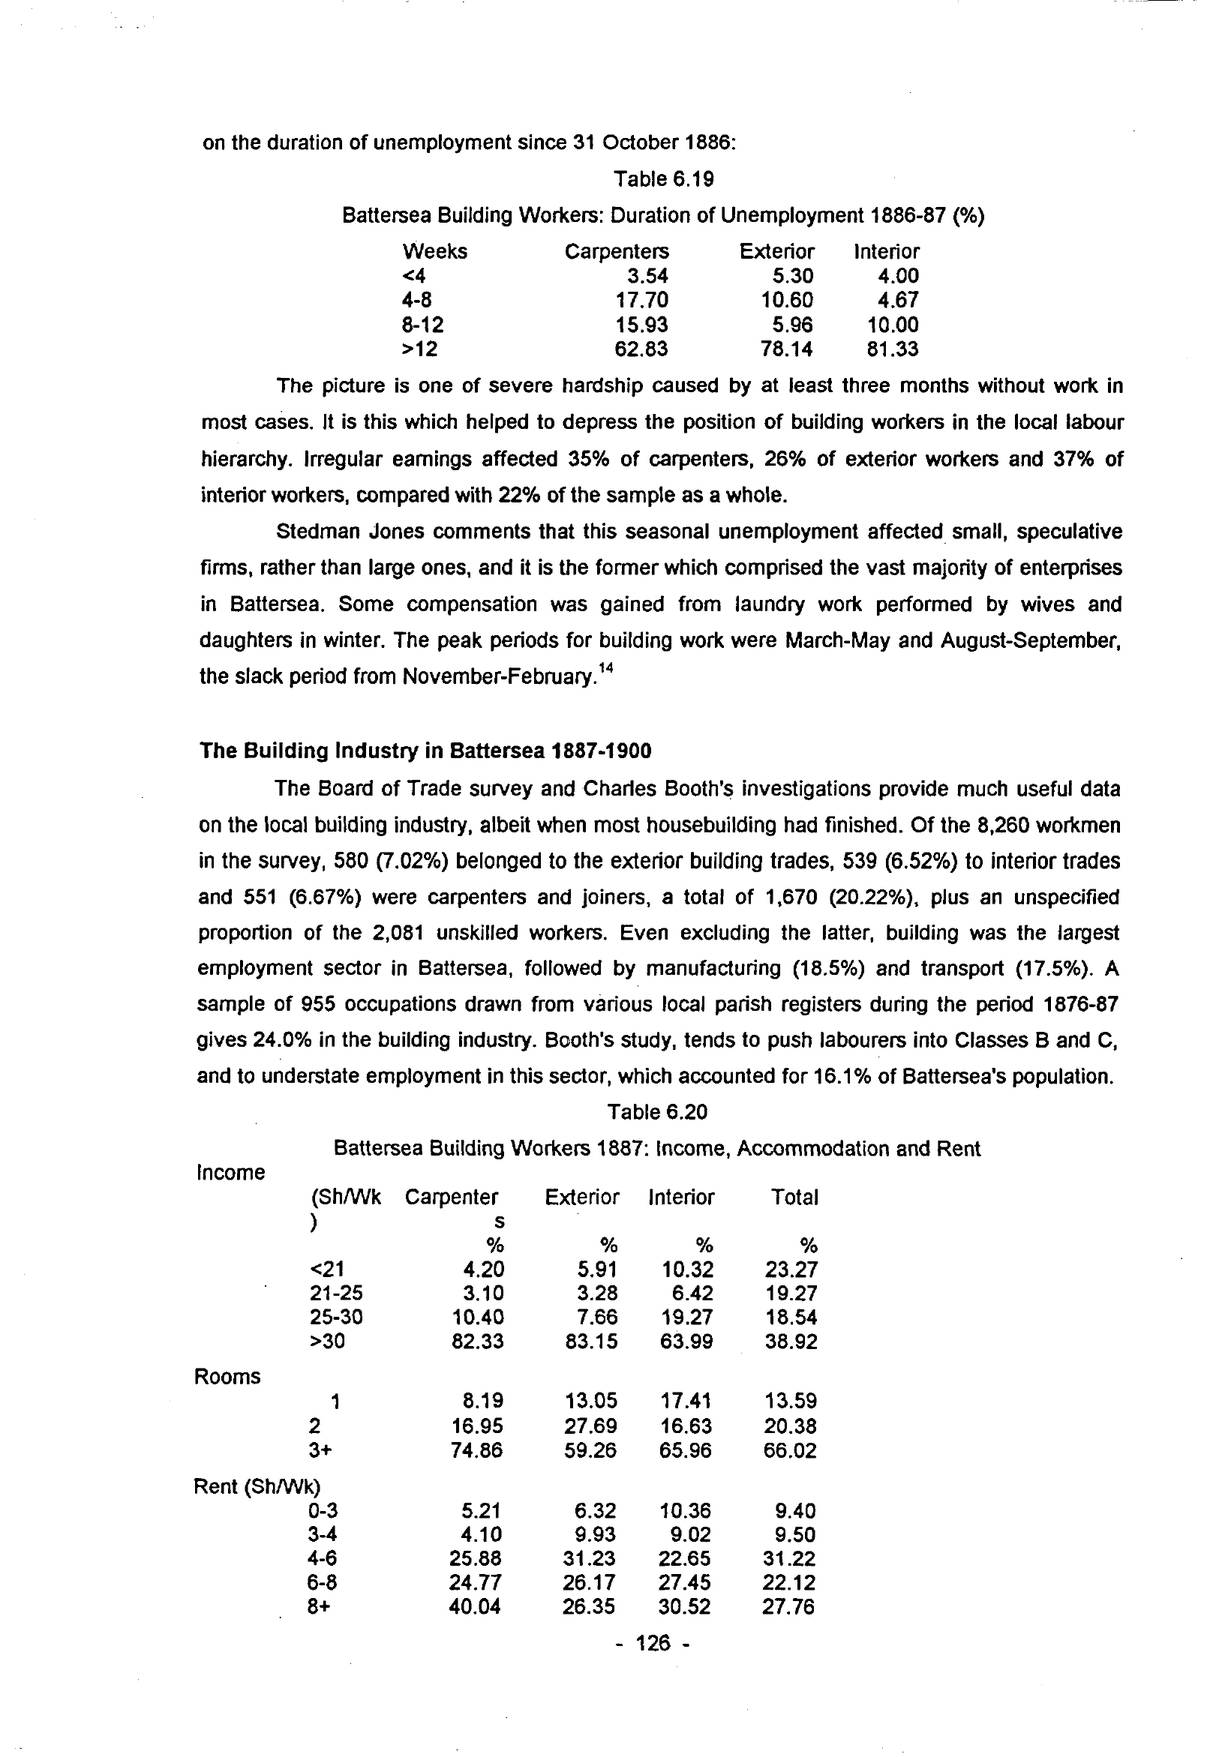
The picture is one of severe hardship caused by at least three months without work in most cases. It is this which helped to depress the position of building workers in the local labour hierarchy. Irregular earnings affected 35% of carpenters, 26% of exterior workers and 37% of interior workers, compared with 22% of the sample as a whole.
Stedman Jones comments that this seasonal unemployment affected small, speculative firms, rather than large ones, and it is the former which comprised the vast majority of enterprises in Battersea. Some compensation was gained from laundry work performed by wives and daughters in winter. The peak periods for building work were March-May and August-September, the slack period from November-February.14
The Building Industry in Battersea 1887-1900
The Board of Trade survey and Charles Booth’s investigations provide much useful data on the local building industry, albeit when most housebuilding had finished. Of the 8,260 workmen in the survey, 580 (7.02%) belonged to the exterior building trades, 539 (6.52%) to interior trades and 551 (6.67%) were carpenters and joiners, a total of 1,670 (20.22%), plus an unspecified proportion of the 2,081 unskilled workers. Even excluding the latter, building was the largest employment sector in Battersea, followed by manufacturing (18.5%) and transport (17.5%). A sample of 955 occupations drawn from various local parish registers during the period 1876-87 gives 24.0% in the building industry. Booth’s study, tends to push labourers into Classes B and C, and to understate employment in this sector, which accounted for 16.1% of Battersea’s population.
| Income | ||||
|---|---|---|---|---|
| (Sh/Wk) | Carpenters | Exterior | Interior | Total |
| % | % | % | % | |
| <21 | 4.20 | 5.91 | 10.32 | 23.27 |
| 21-25 | 3.10 | 3.28 | 6.42 | 19.27 |
| 25-30 | 10.40 | 7.66 | 19.27 | 18.54 |
| >30 | 82.33 | 83.15 | 63.99 | 38.92 |
| Rooms | ||||
| 1 | 8.19 | 13.05 | 17.41 | 13.59 |
| 2 | 16.95 | 27.69 | 16.63 | 20.38 |
| 3+ | 74.86 | 59.26 | 65.96 | 66.02 |
| Rent (Sh/Wk) | ||||
| 0-3 | 5.21 | 6.32 | 10.36 | 9.40 |
| 3-4 | 4.10 | 9.93 | 9.02 | 9.50 |
| 4-6 | 25.88 | 31.23 | 22.65 | 31.22 |
| 6-8 | 24.77 | 26.17 | 27.45 | 22.12 |
| 8+ | 40.04 | 26.35 | 30.52 | 27.76 |
p. 127Building workers were better paid than average, although interior trades earned almost one quarter less than others. High earnings must, of course, be offset against seasonal unemployment and the effects of booms and slumps. High wages are matched by the amount of accommodation rented, especially by carpenters. The other trades were evidently affected by cyclical reductions in earnings, and the 40% of exterior and 34% of interior tradesmen occupying two rooms or less with their families cannot be described in any way as “comfortable”. In terms of rent, carpenters and interior workers are higher than average, 65-68% paying more than six shillings/week, compared with 50% for all workers. Exterior building tradesmen approximate much more closely to the norm. Without detail on the location of the property rented, it is impossible to comment on its quality. In view of the fact that the incidence of seasonal unemployment is no different between indoor and outdoor trades, the apparently lower standard of living of the latter may be a reflection of higher drink consumption, especially as they were better paid.
Taking 32/11 as the weighted average earnings/week for all building workers and a rent of 6/10, 21% went on rent, leaving just £1/6/- for food, clothing, light and other expenditure. The weighted average size of builders’ households in 1887 was 5.3, compared with 5.0 for all workers, giving a per capita allowance of only 4/11 per family member. That it was possible to live within this kind of budget is shown by Mrs. Pember Reeves’ survey of the lower paid in neighbouring Lambeth.15
Considering all the elements of the 1887 survey, building workers generally occupy a low position in the local labour hierarchy, despite high average earnings which place outside trades and carpenters second and third respectively in the wages league table. Irregularity of employment more than compensates for this, and overall (based on earnings; rent; space occupied; family size and unemployment), out of twenty-six groups, carpenters are 8th., inside and outside building workers 21st. equal. In the last two, of course, the large amount of labourers in many trades will have depressed the ranking.
Charles Booth’s survey of June 1889 is not so detailed and contains far less quantitative data. It also includes wives and children in the various categories, making direct comparison with 1887 and the 1891 Census difficult. Booth placed 19,832 people in the building industry, which at an average of 5.3/household gives only 3,742 workers, compared with 5,542 in the 1881 Census and 6,343 in 1891. Even if his data are adjusted to allow for non-household heads, the total only comes to 4,612, and it is clear that, as in 1887, many of unskilled labourers are included in his “Labour” category, rather than building. In 1891, 728 building workers described themselves as labourers, which would reduce the total to 5,615, still well above Booth’s figure.
Even so, at 13% the building trades formed Booth’s largest single group, accounting for almost half of the artisan class.16 They formed about 5% of Class B, but were more prominent in Classes C and D (13%). However, it is Class E (Ordinary standard earnings) where building tradesmen were concentrated, 58.6% being located there (cf.38.5% of the total). Builders and other high status workers formed almost 19% of Class F, the highest working-class group. Some 73% of building workers earned average wages (cf.72% earning [≥?] 25/- per week in 1887). Booth also underscores the significance of irregular earnings, placing almost a quarter of building workers in this category, compared with 15% of the whole population.
p. 128Booth’s notebooks provide information on the living conditions of some building workers. In Orville Road, which had already deteriorated into a slum despite having been built only in 1884-5, an unemployed sawyer lived with nine other people in three first-floor rooms (B); three doors away, a builder’s labourer with a drink problem and a family of seven lived in two rooms (B). Slightly higher up the scale was Carpenters Road, where the only building worker in ten houses was a plasterer, whose family of five lived in three rooms (C). At 25 Benfield Street, lived a builder’s labourer, one of nine crammed into two rooms (C), while next door was an unemployed builder’s man (6 people, 2 rooms) with a drink problem (A). At 56 Speke Road, a paperhanger (3 people, 3 rooms – E), enjoyed a vastly better standard of living.
Suppliers of Building Materials
The supply of building materials in Victorian Battersea (and, indeed, in London as a whole) is a much-neglected subject.17 The Census persistently records very few in this sector of the industry, and even allowing for supplies obtained outside the parish, there seems to be a great gap between the demand and supply. Locally made bricks, although important on one or two individual estates, can never have met all demands, and after 1880 diminished rapidly as suitable land was exhausted and built over. Not only were materials required for more than 24,000 dwellings between 1840 and 1915, but also for dozens of churches and chapels, for industrial premises, public buildings, sewers and above all for railways, whose demand for viaducts, stations and workshops between 1838 and 1875 would have required millions of bricks.
Pocock’s brickfield operated from 1845 until c.1882, producing bright yellow bricks which weathered to the usual brown of London stocks. Unfortunately, Pocock does not give any estimate of output, nor of their use other than on his own estates in Brompton and Battersea. Assuming 25,000 bricks/house on average, and a total of 400 houses, output would have been ten million bricks, about 0.27m/year. (This compares with a total demand of at least one billion bricks across Battersea.) In 1851, nine brickmakers were employed by Pocock. In 1871 and 1891 there were fifteen brickmakers in Battersea, although their place of work is unclear.
There is even less information on other brickfields. William Morrison operated a small one off Bridge Road to supply the estate which he began in 1845, and another existed about the same time on John Alder’s land north of Battersea Park Road. Part of the never finished, Earl Spencer Place off the same road was let for brickmaking. John Bailey agreed to pay the developer, Henry Hart Davis, £196 p.a. for land on both sides of the road, and to make at least three million bricks, paying a royalty of 4/- per thousand after duty.18 Although the measurements on the plan are imprecise, this suggests an anticipated yield of c.2.5 million bricks/acre, equivalent to 15-bricks depth. On the same basis, Pocock would have produced 20-25m bricks (see above).
Two brick dealers are mentioned in the 1861 Census – Alfred Powell in the High Street and John Blake at Falcon Villas – neither had any employees, but the latter may have worked for Pocock. John Merritt certainly did. Born at Egham (Surrey) in 1831, he was a brickwork contractor in 1871, having been the foreman/manager at Falcon Brickfield since the 1850s.
The 1884 Directory records three brick merchants in Battersea. Alfred Lavers had operated a wharf for building materials at Nine Elms since at least 1871, and probably imported
p. 129his supply from the brickfields of the Medway/Thames estuary. West Brothers, who supplied “all kinds of building and paving bricks and tiles” operated from Lombard Wharf in west Battersea. P.J. Dawson & Co. Ltd. were based at Mendip Wharf, with yards at Durham Wharf, Jews Row, Wandsworth, 143 Falcon Road and the LNWR yard at Falcon Lane, where they remained until the 1980s. In 1897 they advertised the landing and cartage of bricks to any part of the district. Eastwood & Co., based at Lambeth with yards at Wandsworth and Fulham were prominent after 1900, trading mainly in bricks, lime and cement, owning several brickfields in the Medway area and Bedfordshire.
The Barham Brick Lime & Cement Co. Ltd. was based at Victoria Wharf and Draw Dock Nine Elms, and taken over by Associated Portland Cement in 1900. In December 1870, the stock in trade of a previous brick, tile, lime and slate merchant had been sold by auction at Victoria Wharf, and the sale particulars provide the only detailed survey of this kind of business.19 The principal item was 170,000 new bricks, including stocks, place, grissells, red and white Suffolks, gaults, facings and copings. Many of these would have been used even on houses built of local brick, for decorating the facades. Roofing materials comprised 32,000 tiles and 31,000 slates. Specialist bricks and tiles, for example firebricks, came from as far afield as Staffordshire and Yorkshire, brought by rail to the nearby Battersea Wharf goods yard as well as by coaster. Other items for sale included plasterer’s hair, laths, garden edging, locks, barrows and lime baskets. Distribution from the yard to its local customers involved eight horses, all named, two four-ton vans and three carts. The owner had enjoyed a brougham. The wharf office was fully-equipped with mahogany desks and fixtures. The almost-contemporary OS Plan shows Victoria Wharf with a long range of buildings, comprising storage bays and stables along the east and south sides, a large yard and an inlet from the river for unloading barges. In 1851, there had been a cement works at Nine Elms, and also John Thornton’s whiting and lime works, employing thirteen men and five boys. Other white lead manufacturers were based near the Church, including John Trott, aged 39, from Somerset, employing four men and two boys.
Building material suppliers were also involved directly in building. J. Mussett of Winstanley Road, for example, was a horticultural builder and gas engineer. He supplied equipment for greenhouses and hot-water apparatus. In October 1889, he tendered for replacing the pipes in Battersea Vestry Hall for £37.20 No doubt many local builders took used firms like Young & Marten of Stratford, established 1872, and William Cooper of Old Kent Road, Hatcham.21 They supplied a host of decorative and useful features, the former specialising in interior fittings, the latter in garden supplies, but also extending to corrugated iron churches, school rooms and even cottages. The tiled grates and stained glass which graced many a late-Victorian house in Battersea could be obtained in a huge variety of styles from Young & Marten, and used to make each ostensibly identical terraced house seem different to prospective tenants.
General suppliers of building materials in the late-Victorian period include Hall & Co. at New Wandsworth goods depot and Harwood & Jones of 481 Battersea Park Road, both of whom survived until 1914. Lime for cement and mortar was supplied by firms such as the Dorking Lime Co. in Victoria Road (in the LB&SCR goods yard) and Marshall & Co., coal, lime and cement merchants who began at Wandsworth Common Station c.1879 and moved to Balham by 1884.
p. 130There seems to have been a considerable element of “recycling” in the supply of materials. In March 1868, an auction was held at the corner of Plough Lane, mostly of timber, including scaffolding poles and 500 planks.22 That June, George Todd advertised the sale of one million bricks from demolitions for the new Law Courts, priced at 11/- per thousand in carts, or 15/- loaded in barges or railway wagons.23 Locally, the sale of effects at Bolingbroke Farm in advance of the laying out of the CLS’s third estate, 100,000 stock bricks, bressumers, girders and long joists were offered for sale.24 Todd sold materials at Gwynne Wharf in October 1868, as the area was cleared for James Lord’s estate.25 Interior fittings were also sold, for example twenty marble chimney pieces, stoves and ranges, next to the ‘Lord Auckland’, Clapham Junction.26 During the depression of the early 1870s, George Todd auctioned contractor’s plant at the ‘Latchmere’, including a 4 h.p. engine, two pumps, seven carts, 18 barrows, a timber carriage, elm and other timber, 2,000 sq. ft. of old weatherboarding and a blacksmith’s forge.27 A sale held at Cairns Road in September 1870 included five horses and eight carts.28 3-5 Newcomen Rd. were demolished in 1878, releasing 70,000 bricks, joists, flooring, tiles and shop fronts to be reused.29 The building of Battersea Park Road Board School in 1881 necessitated the demolition of 147-9, two substantial properties with outbuildings and stables, yielding 200,000 stock bricks.30
Timber merchants were long-established locally, the so-called Church Docks along the riverfront of Battersea Marsh having been leased as timber ponds from at least the seventeenth century.31 This timber would have been used in the local boat- and ship-building industry, as well as for building, and it is impossible to quantify the latter. The number of merchants and others in the timber industry grew from seven in 1851 to 17 in 1871 and 1891. After 1870, shipbuilding had disappeared, and thereafter it is probable that construction took the bulk of local imports.
Also significant were the manufacturing joiners, who supplied mass-produced skirtings, dados, staircases and roof trusses. Although this type of prefabrication was developed by large-scale builders such as Thomas Cubitt from the 1840s,32 and several “staircase makers” are recorded in locally from 1861, it is not really until the 1900s that factory-made joinery becomes prominent, as local directories show:
| G.R. Mackenzie & Co. | Queens Road | 1908 |
| Chas. Peacock & Co. | St. Andrew St. | 1902-10 (steam joinery) |
| Henry Roach | Hope St. | 1909-10 |
| James Welch | Ingrave St. | 1905-10 (a builder in 1902) |
Before this, such wood was probably supplied by timber merchants, or made on site by joiners.
As already noted, the supply and fixing of roofing materials is even less well documented, except for the Victoria Wharf sale of 1870. John Jones of Sussex Terrace, New Road, was a slate merchant in 1871, aged 49. He may have worked at one of the local railway goods depots, or at a wharf in Nine Elms. By 1884, Hall & Co., and George Smith of 147 Falcon Road dealt in slates, the latter very close to the LNWR goods yard with direct access to North Wales slate. In 1905, Bingley, Son & Follitt Ltd., slate merchants, slaters and tilers of Millbank had depots at Chelsea Basin, Falcon Lane and Mold Junction (Flints.), all connected by the LNWR. Their steam works in Fulham was called Velinheli Wharf. The London Steam Stone Saw Mills Co. operated off Stewarts Road in the 1880s and 1890s, no doubt providing for the growing market in architectural embellishment.
p. 131Although not supplying purely local needs, apart from new mansion flats and commercial premises, it is notable that Battersea contained all three specialist lift and hoist manufacturers listed in London Directories of the Edwardian period. George Johnson had first appeared in Battersea as a builder in 1858, and has been based at 227 St. Johns Hill ever since, specialising in lifts from the 1880s. James Ritchie & Sons were at 9 Henning St., and Archibald Smith & Stevens built lifts at Janus Works, Queens Road.
This necessarily partial discussion of building materials and their supply, makes it clear that substantial quantities must have been obtained outside Battersea, especially during the peaks of the late-1840s and mid-1860s, when there is little or no mention of local suppliers. The railways no doubt transported not only materials for their own lines and buildings, but also for other local construction. The northern railways which developed goods yards in Battersea and other south London suburbs after 1860 were not merely in the business of carrying coal, as evidenced by the fact that it is these yards and Thames-side wharves which were the location of the majority of builder’s merchants and suppliers after 1880. The LNWR tapped not only Welsh and Pennine slate, but also the brick and tile works of the West Midlands (e.g. Minton at Coalbrookdale), while the Midland served the brickfields of Bedford and Derbyshire, as well as several stone-producing districts. The LCDR may have carried some bricks from the Medway area, although most seem to have come by barge, while the LSWR brought materials from the south-west, such as granite and Portland stone. Many of the sailing barges noted in the various Censuses came from Rochester and other ports on the Medway/Lower Thames, and some at least probably carried cargoes of bricks, and possibly other building materials.